Dashboard
The Dashboard is the primary interface for monitoring disaster events. It combines an interactive map with a filterable event list, giving response teams…
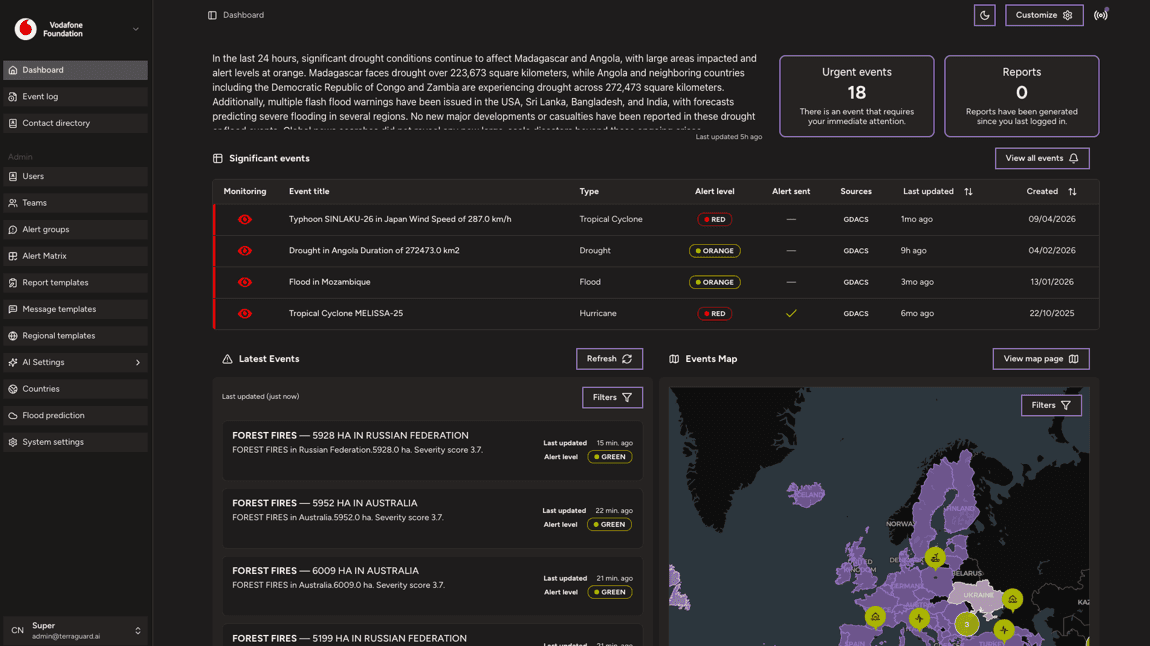
The Dashboard is the primary interface for monitoring disaster events. It combines an interactive map with a filterable event list, giving response teams a comprehensive view of ongoing and recent disasters across all monitored data sources.
AI Summary
At the top of the dashboard, an AI-generated text summary describes the most significant events in the last 24 hours. This summary is automatically refreshed and highlights key developing situations, including affected countries, disaster types, and severity.
Urgent Events Counter
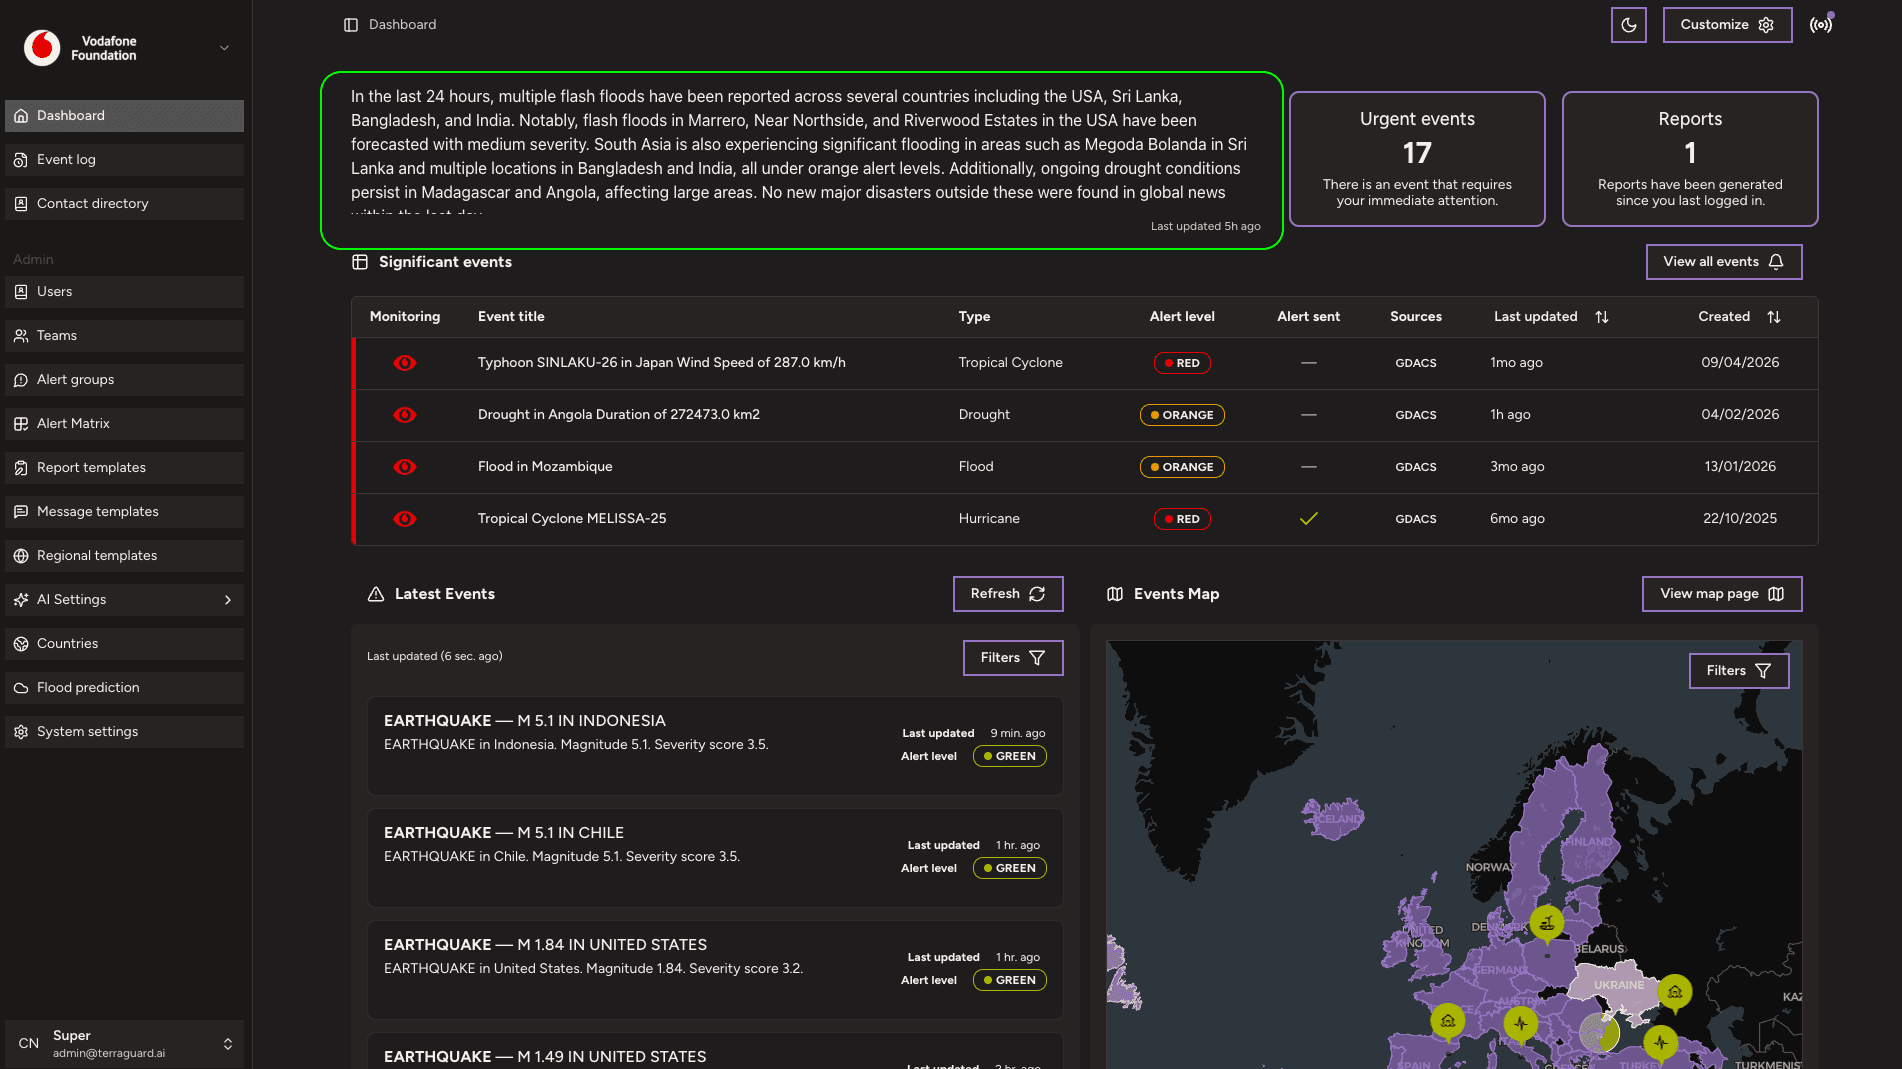
The Urgent Events card displays the total number of events that currently require immediate attention (RED or ORANGE alert level). Clicking this card takes you to a filtered view of the Event Log showing only urgent events.
Reports Counter
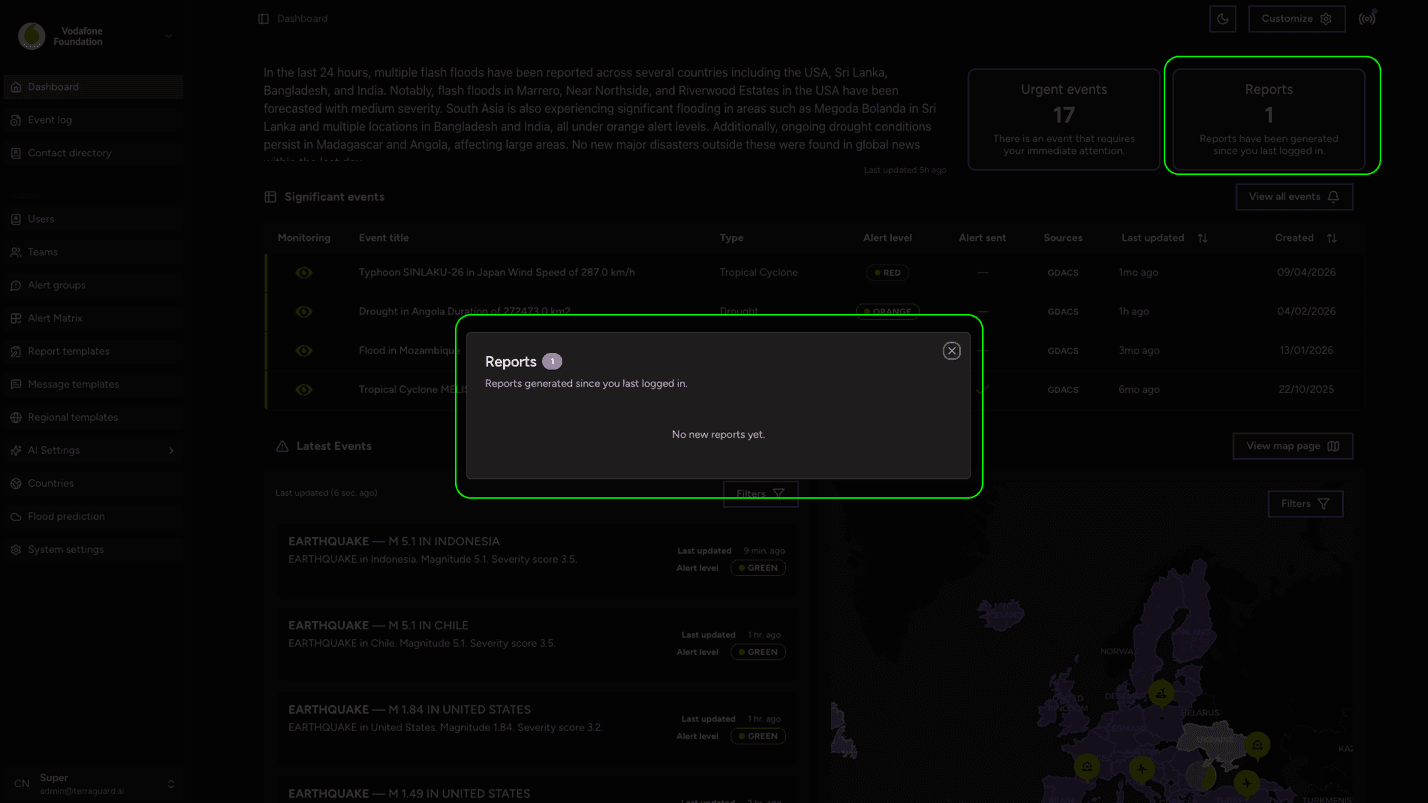
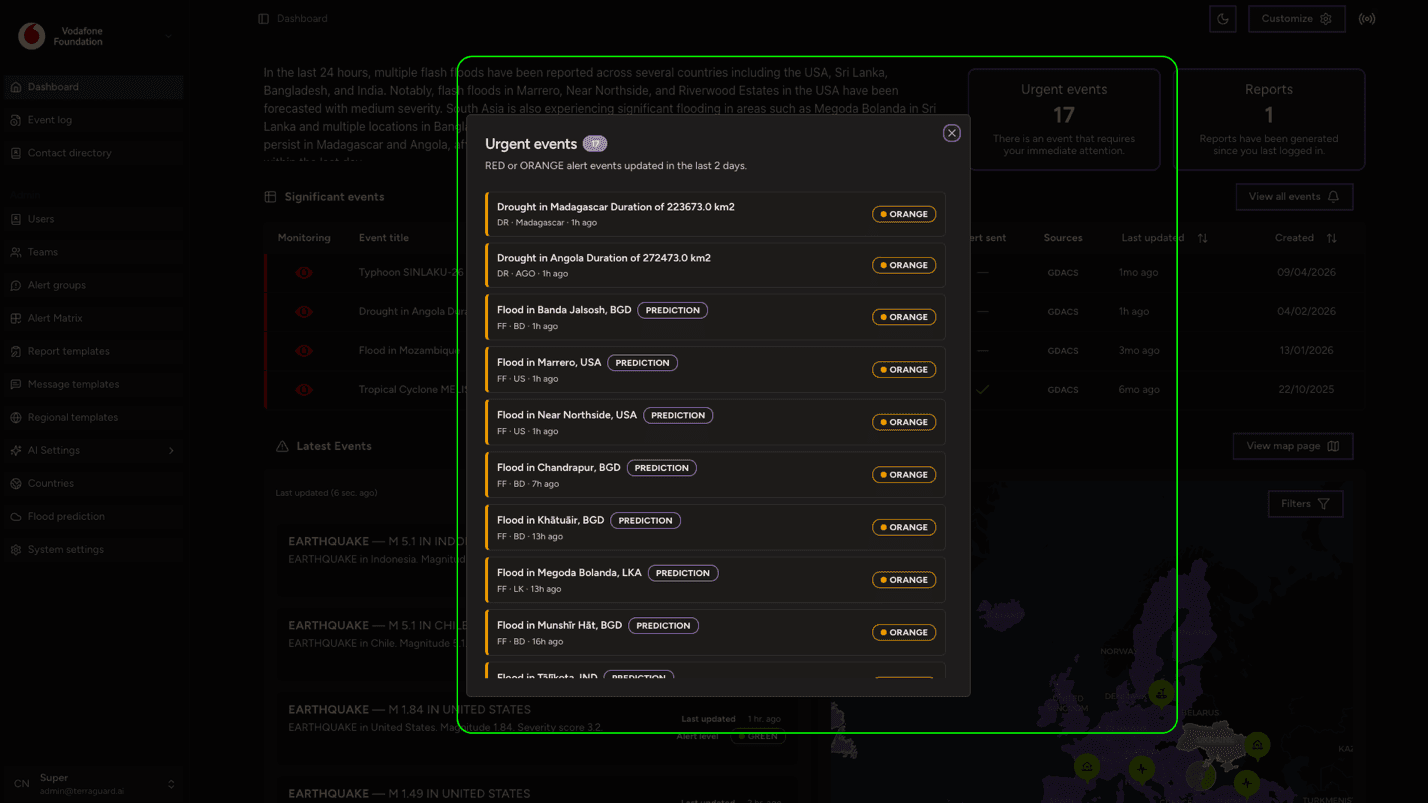
The Reports card shows how many reports have been generated since you last logged in. Clicking it navigates to the reports section where you can view and download generated reports.
Significant Events Table
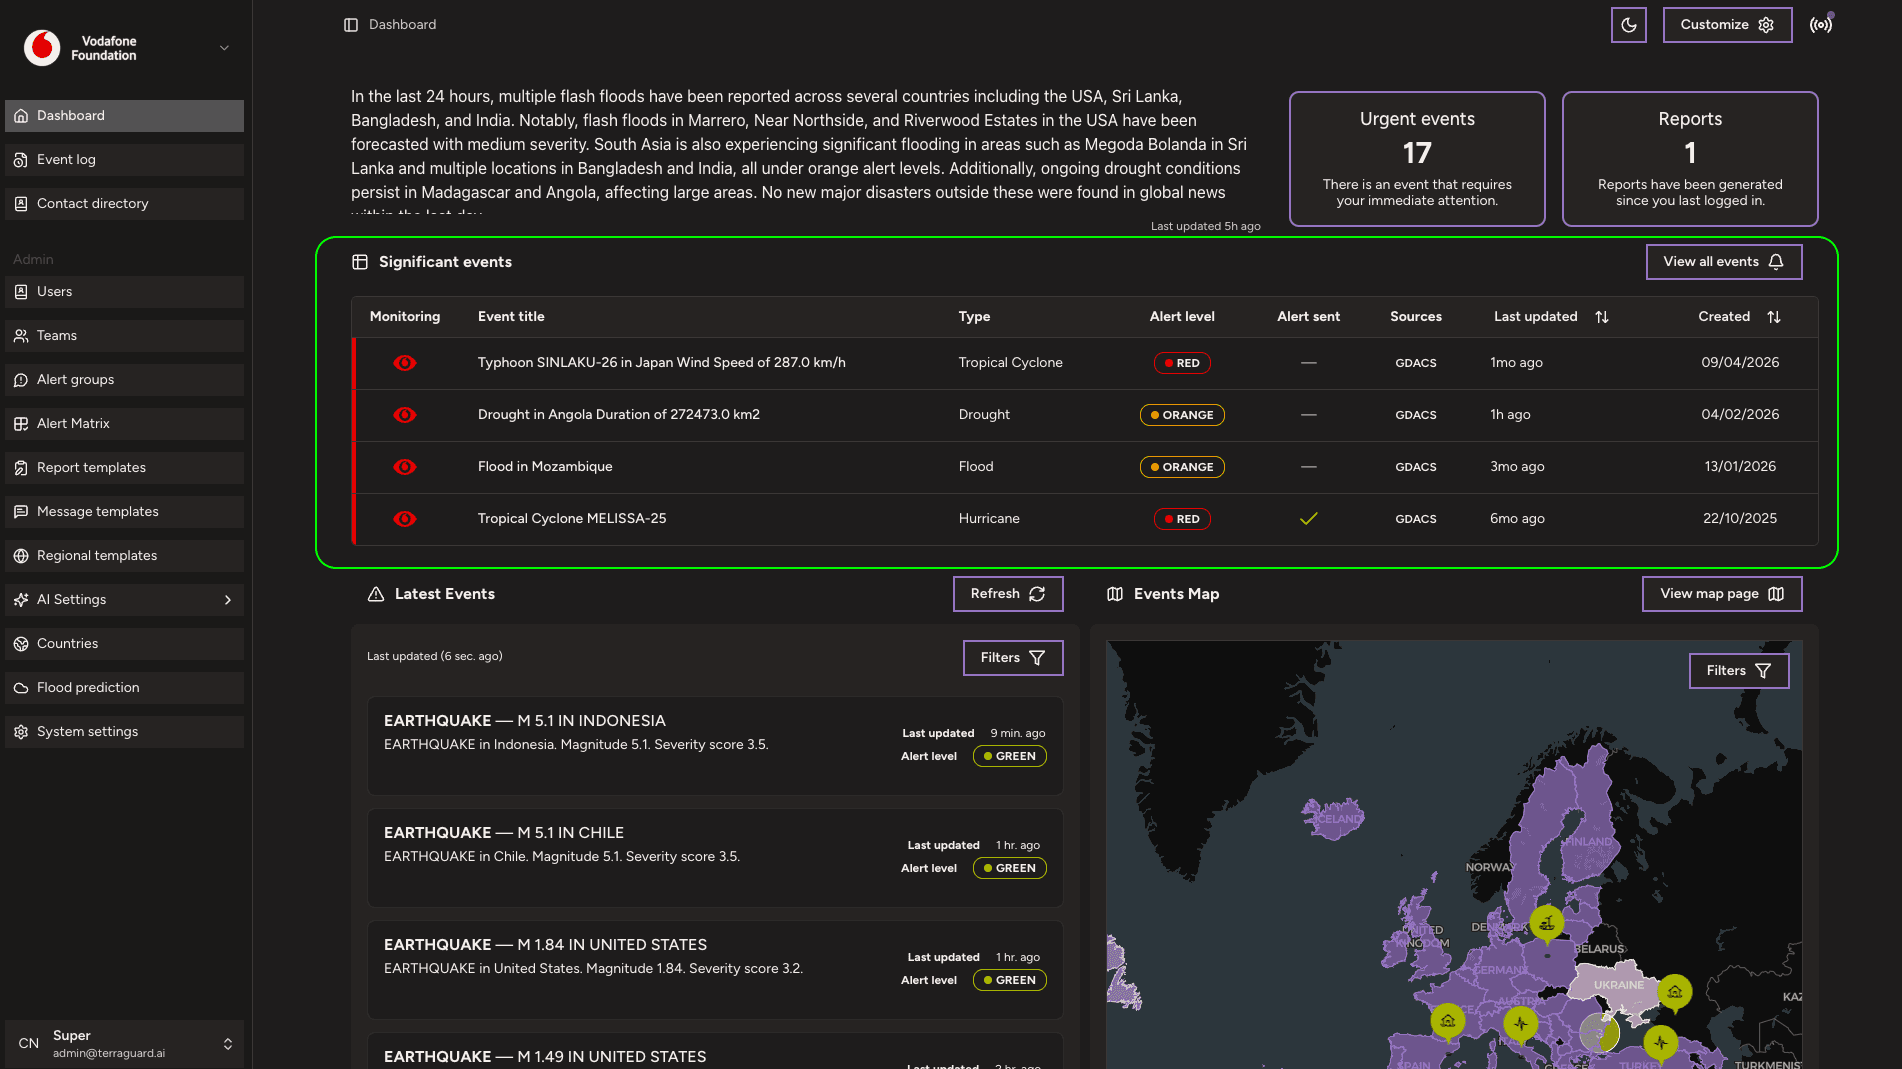
The Significant Events table lists the most important currently monitored events. Each row displays:
- Monitoring — whether the event is being actively monitored (eye icon)
- Event Title — name and key detail of the event
- Type — disaster category (e.g., Tropical Cyclone, Drought, Flood, Hurricane)
- Alert Level — current severity (GREEN / ORANGE / RED)
- Alert Sent — whether an alert notification has been sent
- Sources — data source (e.g., GDACS, USGS, NHC)
- Last Updated — when the event data was last refreshed
- Created — when the event was first detected
Click View all events to open the full Event Log.
Latest Events Feed
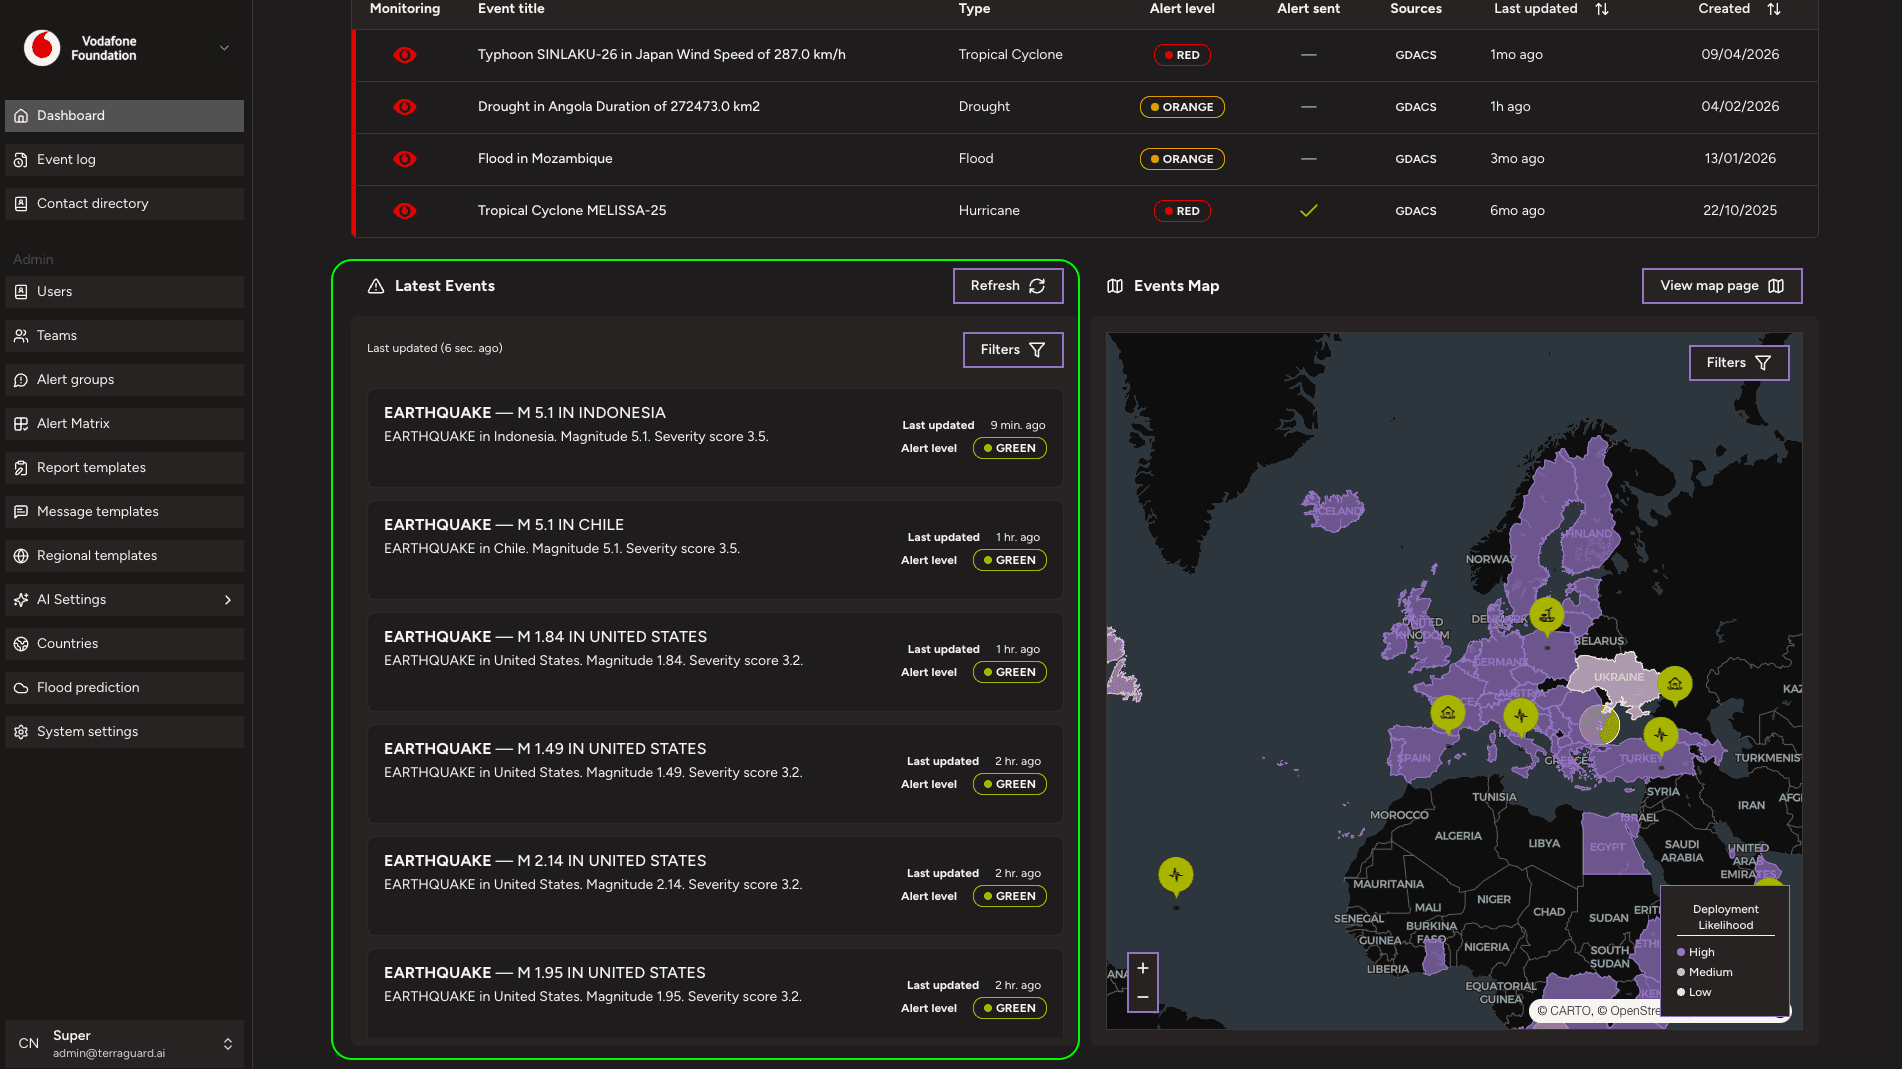
The Latest Events section shows the most recently detected events in real time. Each card shows the event type, location, description, last update time, and alert level. Use the Refresh button to pull the latest data. Use the Filters button to narrow events by type, region, or alert level.
Events Map
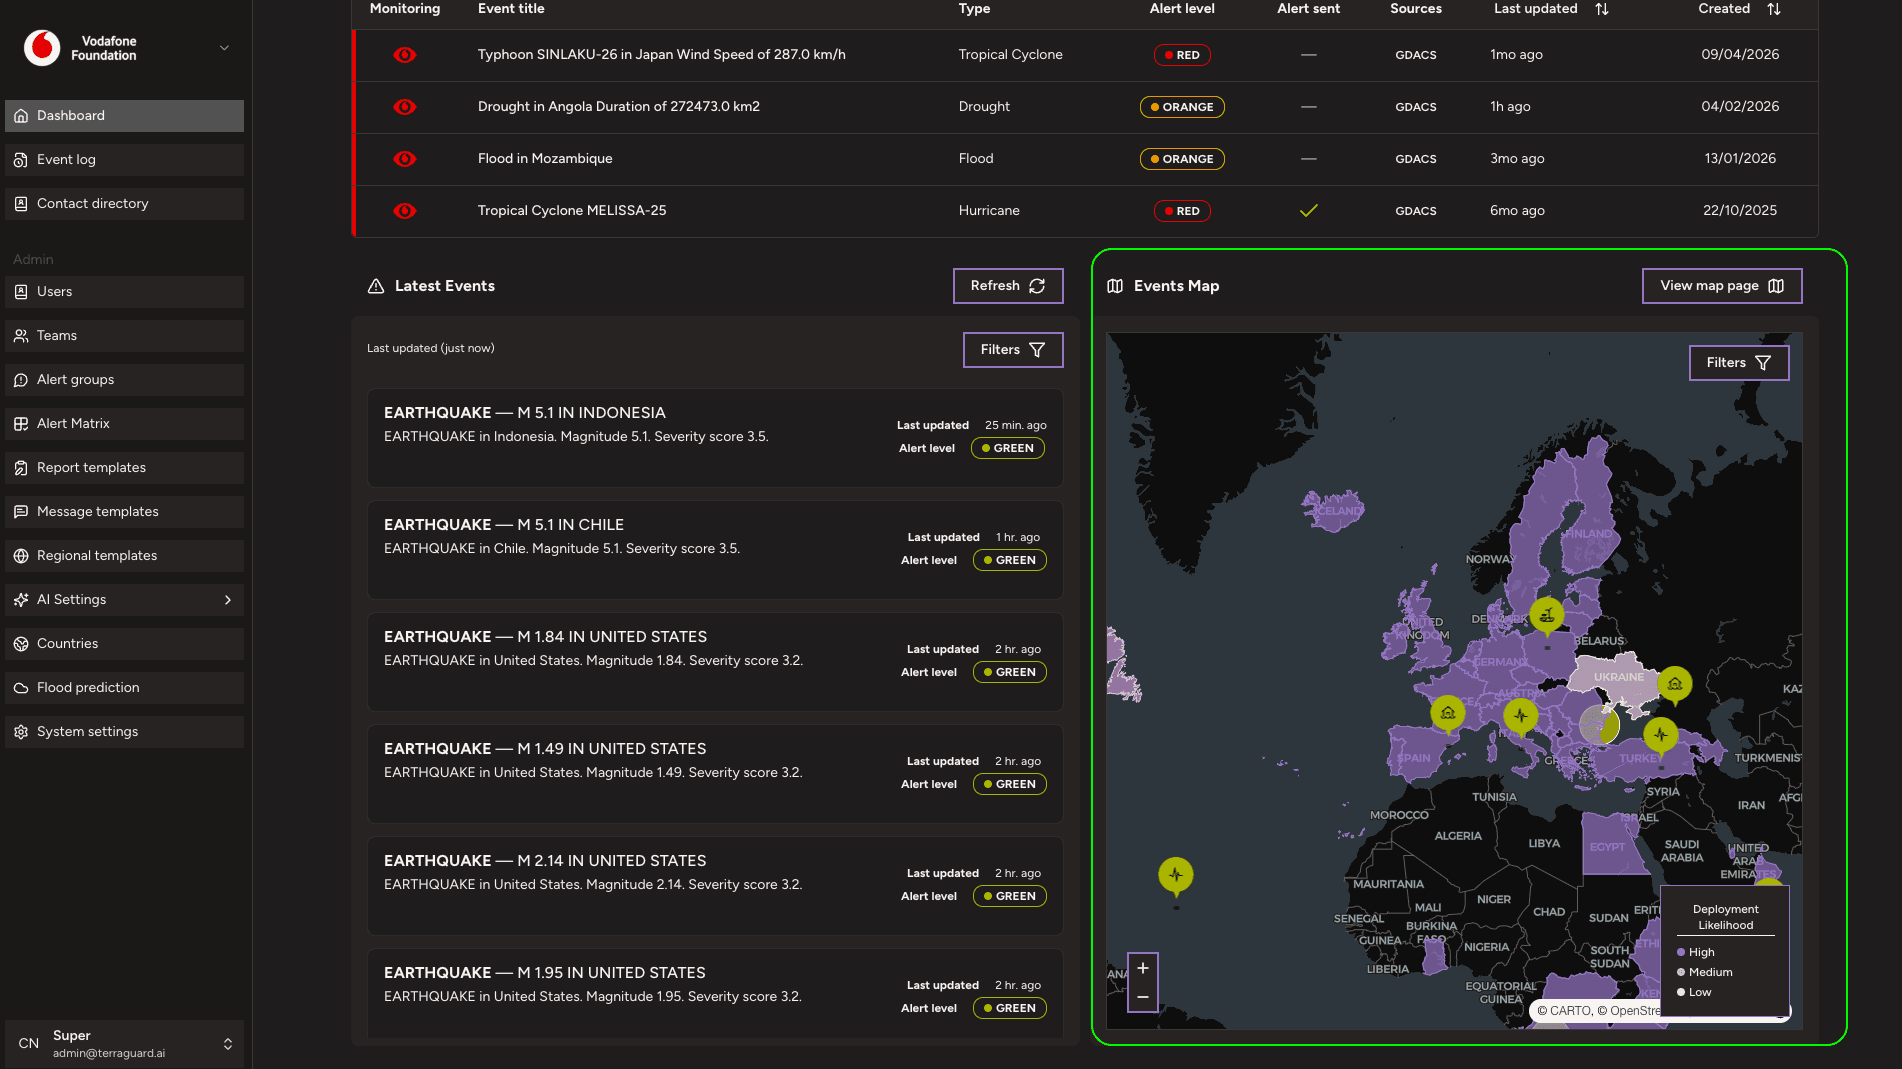
The Events Map provides a geographic view of all current events built with MapLibre GL. Colour-coded markers indicate alert levels: red for RED, orange for ORANGE, and green for GREEN. Each marker also displays an icon for the disaster type (earthquake, cyclone, flood, volcano, drought, wildfire). When zoomed out, nearby markers cluster automatically — the cluster shows a count and is coloured by the highest alert level inside it. Click any marker to see a brief summary and a link to the full event detail. Click View map page for a full-screen map experience.
Filtering Events
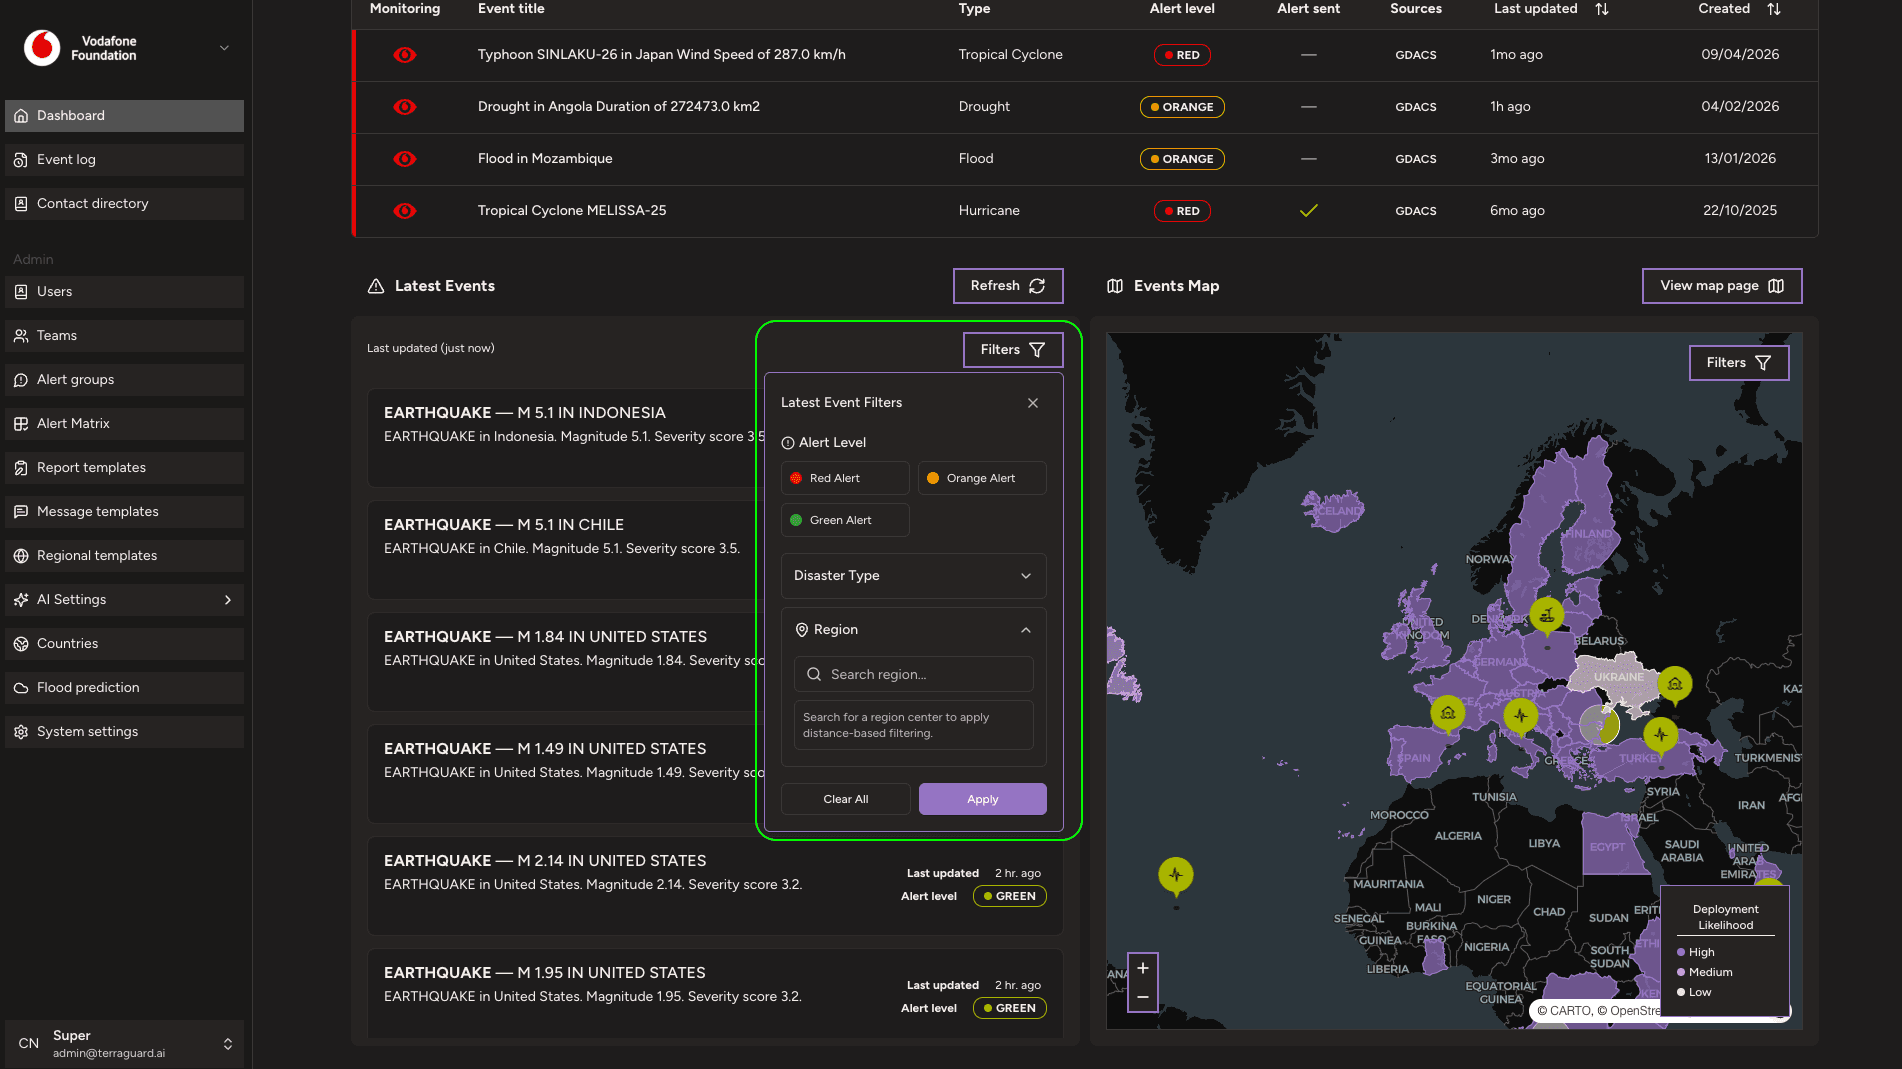
Use the Filters panel to narrow events by event type, alert level, date range (with presets: last 24 hours, 7 days, 30 days, or custom), country, and data source. Filters combine with AND logic and update both the map and the event list in real time. Active filters are shown as removable chips. The URL updates with filter parameters so filtered views can be bookmarked or shared.
Getting Started
To access TerraGuard AI, navigate to https://app-beta.terraguard.ai/ in your web browser. Sign in using your Google account via the Google Sign-In button,…
Event Log
The Event Log provides a complete, searchable history of all events that have been detected and monitored by the platform.