Event Log
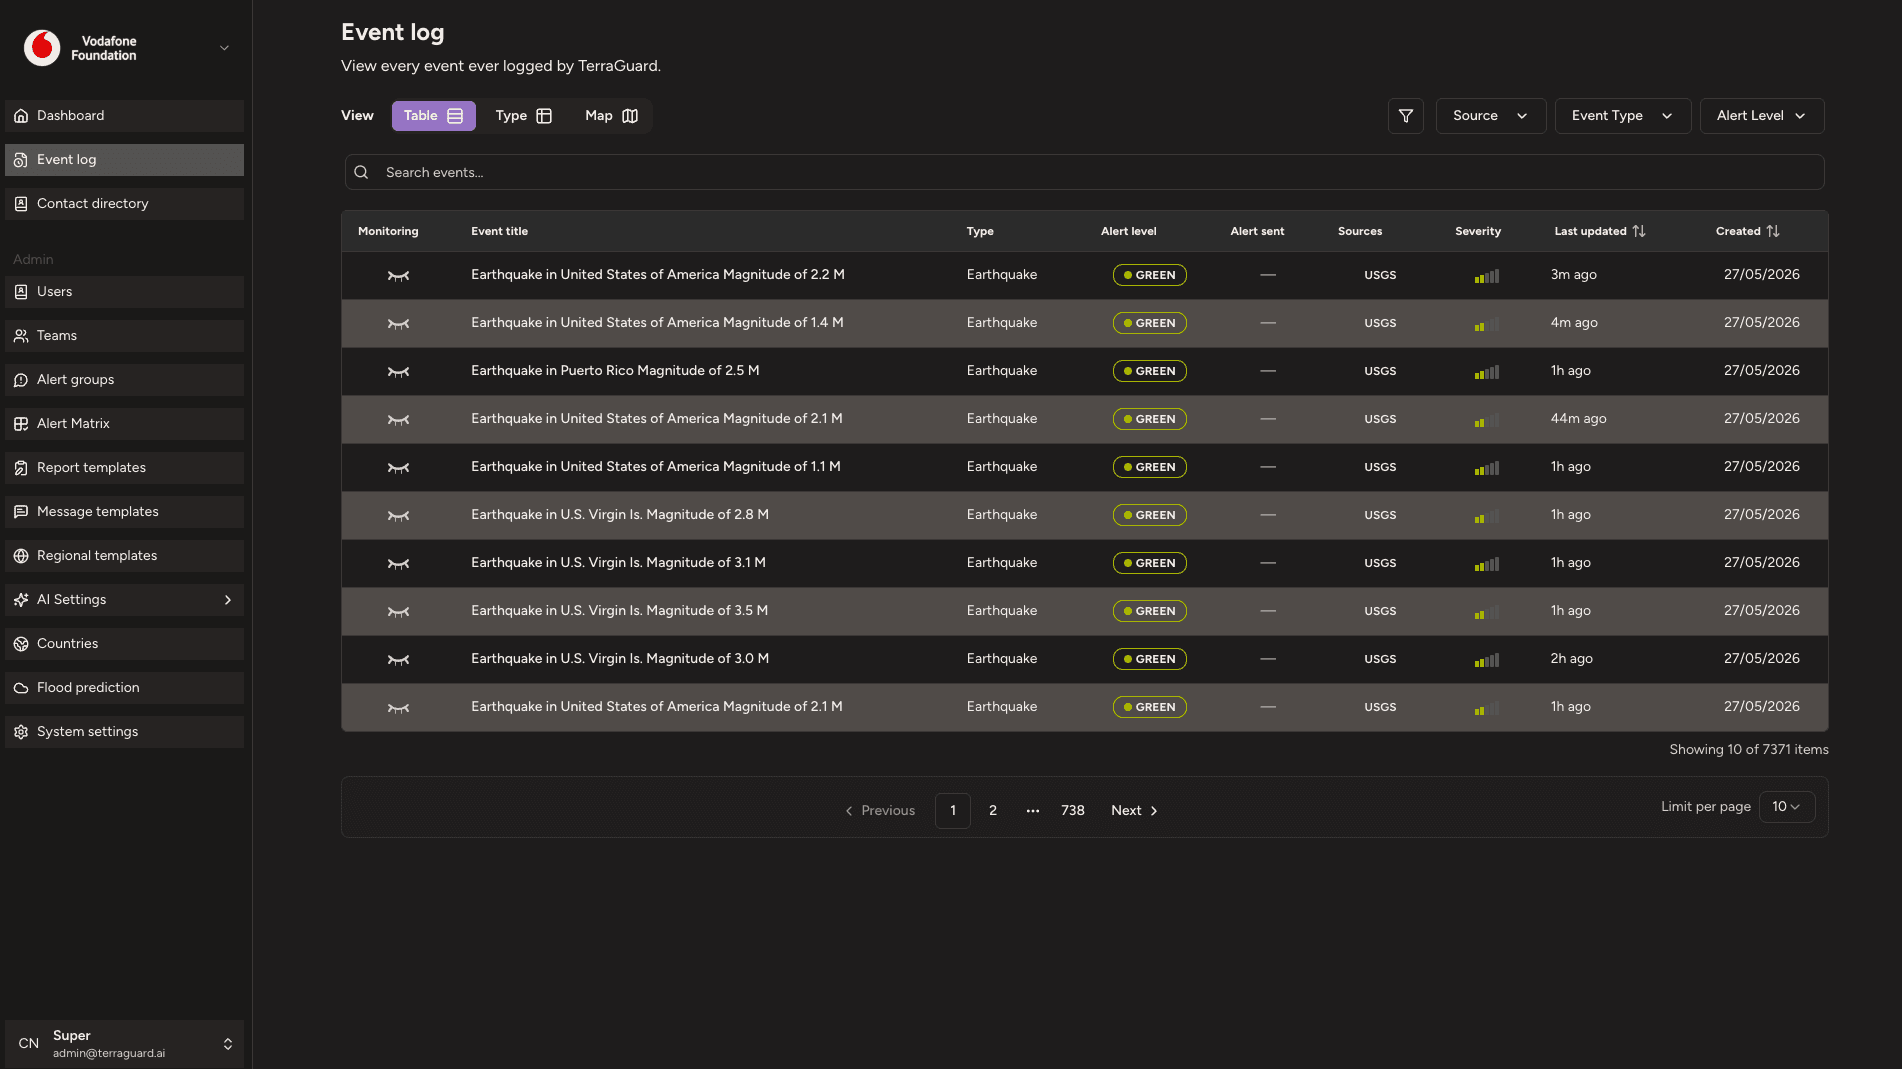
The Event Log provides a complete, searchable history of all events that have been detected and monitored by the platform.
The Event Log provides a complete, searchable history of all events that have been detected and monitored by the platform.
Viewing Events
Each row in the event log represents a single event. The columns match those in the Significant Events table on the Dashboard. Click on any event row to open its detailed view.
Event Detail View
Clicking any event row opens the Event Detail page. The page header shows the event title (editable by admins), a Monitor this event toggle, a Log button that jumps directly to the Timeline tab, and a Configure button for setting labels, lifecycle status, and notification preferences.
If an event was promoted from a flood forecast (Google Flood Forecasting API) rather than confirmed by a ground-truth source, a yellow warning banner appears at the top reading 'Predicted event — not yet confirmed'. Conversely, if a previously predicted event has now been confirmed, a banner links back to the original prediction.
Below the header, eight tabs organise all event information:
- Details — alert level, event facts, severity score, location map, AI summary
- Documents & Sites — uploaded files and pinned crawl URLs
- News & Media — crawled news articles and the indexing pipeline
- Timeline — system audit log and scheduled jobs (Super Admin only)
- Report — generated formal reports
- Deployment — team dispatch records
- Notes — internal notes for your organisation
- Contacts — event-specific and country-level contacts
Details Tab
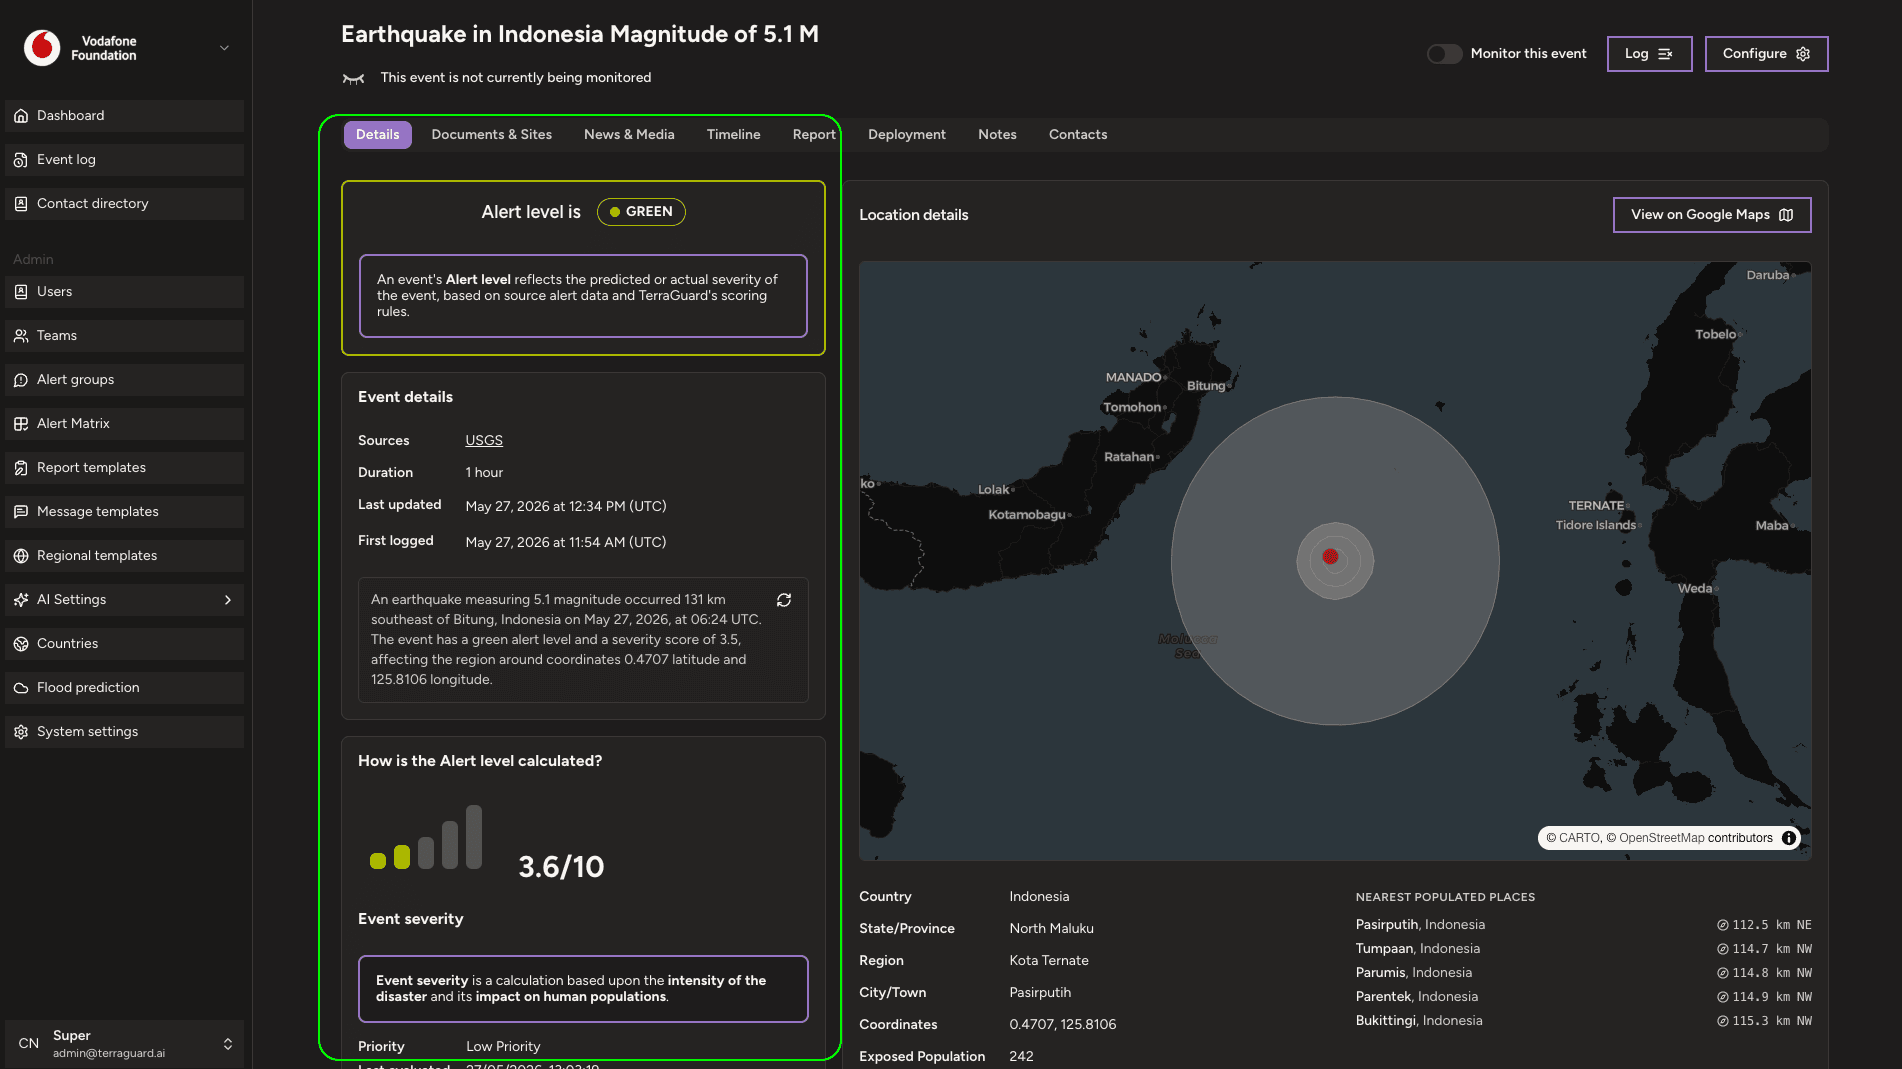
The Details tab is the landing view when you first open an event. It is divided into three columns on wider screens.
The left column contains three stacked cards. The Alert Level panel displays the current alert level — GREEN, ORANGE, or RED — as a large coloured badge, together with an explanation that the level reflects predicted or actual severity based on source data and TerraGuard's scoring rules. The Event Details card shows Source (e.g. GDACS, USGS, NHC), Start time, End time (if resolved), and Last updated timestamp. It also shows a short AI-generated summary sentence for the event; clicking the refresh icon regenerates this short summary on demand. The Severity Details card shows the internal severity score (0–10), a severity label (Low / Moderate / High / Critical), and an accordion that expands to show the individual score components and the AI-generated rationale for the score.
The right two columns show the Location Details card, which contains a live MapLibre GL map centred on the event coordinates, a View on Google Maps link, and a data grid showing Country, State/Province, Region, City/Town, Coordinates, and the nearest populated places with distances.
Below the two-column grid, a compact mini-timeline shows the most recent system milestones for the event — detections, enrichment runs, and alert level changes.
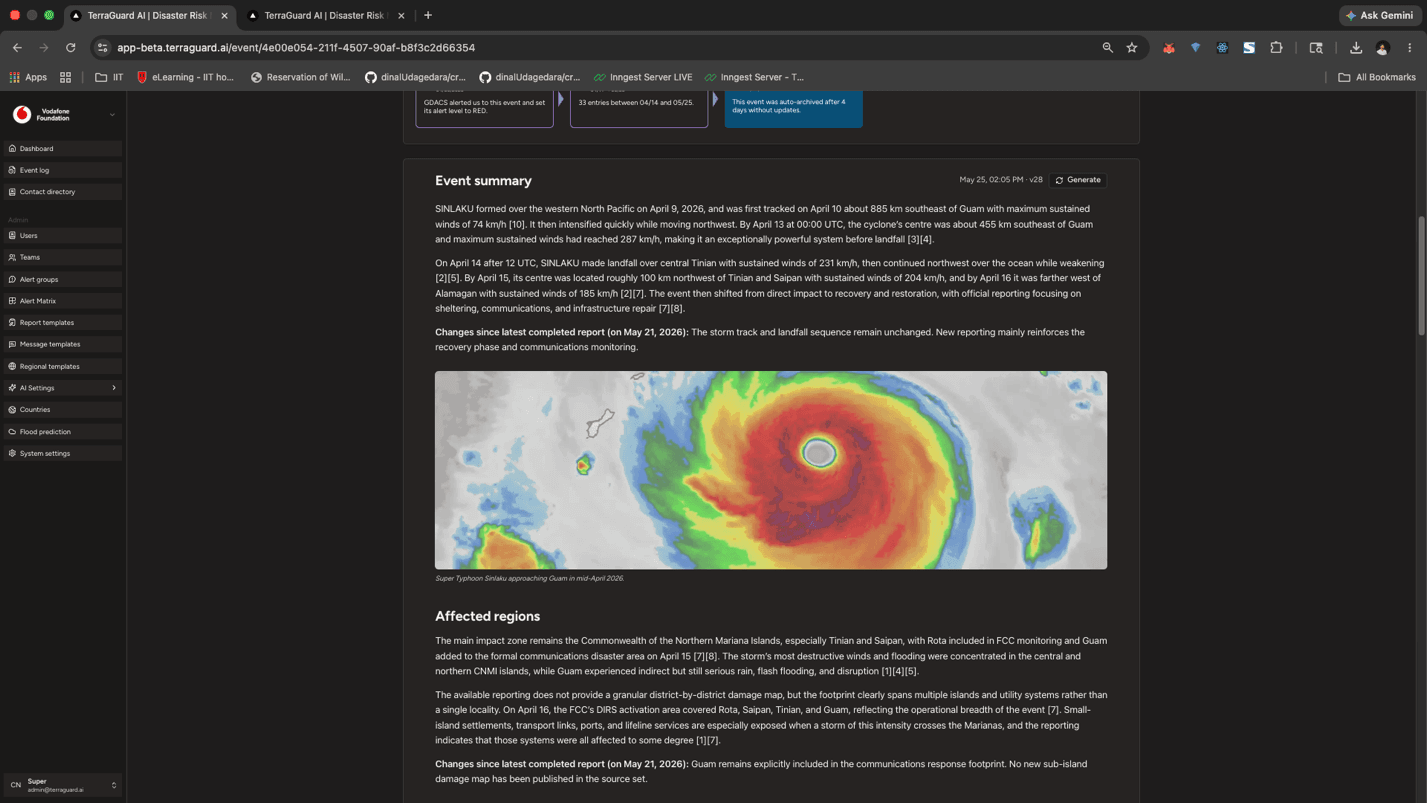
The remainder of the Details tab is the AI Summary accordion. This large collapsible section presents the full AI-generated situation report, organised into:
- Event summary — what happened, when, and where
- Affected regions — countries and sub-national areas impacted
- Outlook (next seven days) — expected trajectory
- Impact Assessment — Human impact and Infrastructure impact subsections
- Response and Recovery — Emergency Response, Key Responders, Recovery Plans, and Challenges subsections
- Conclusion — Emergency Response conclusion, Recommendations, and VF Support Opportunities
- Sources — numbered list of crawled articles and reports that grounded the summary, with publication date and crawl date
Each section shows a 'Limited public information' badge if the AI agent found insufficient data for that topic. Super Admins see a 'Regenerate summary' button in the Event summary accordion header; clicking it triggers a new AI run using the latest indexed knowledge. A progress indicator shows the current phase (Searching, Crawling, Writing) while generation is in progress. If no knowledge base content exists yet, a confirmation dialog asks whether to proceed with event metadata only.
Documents & Sites Tab
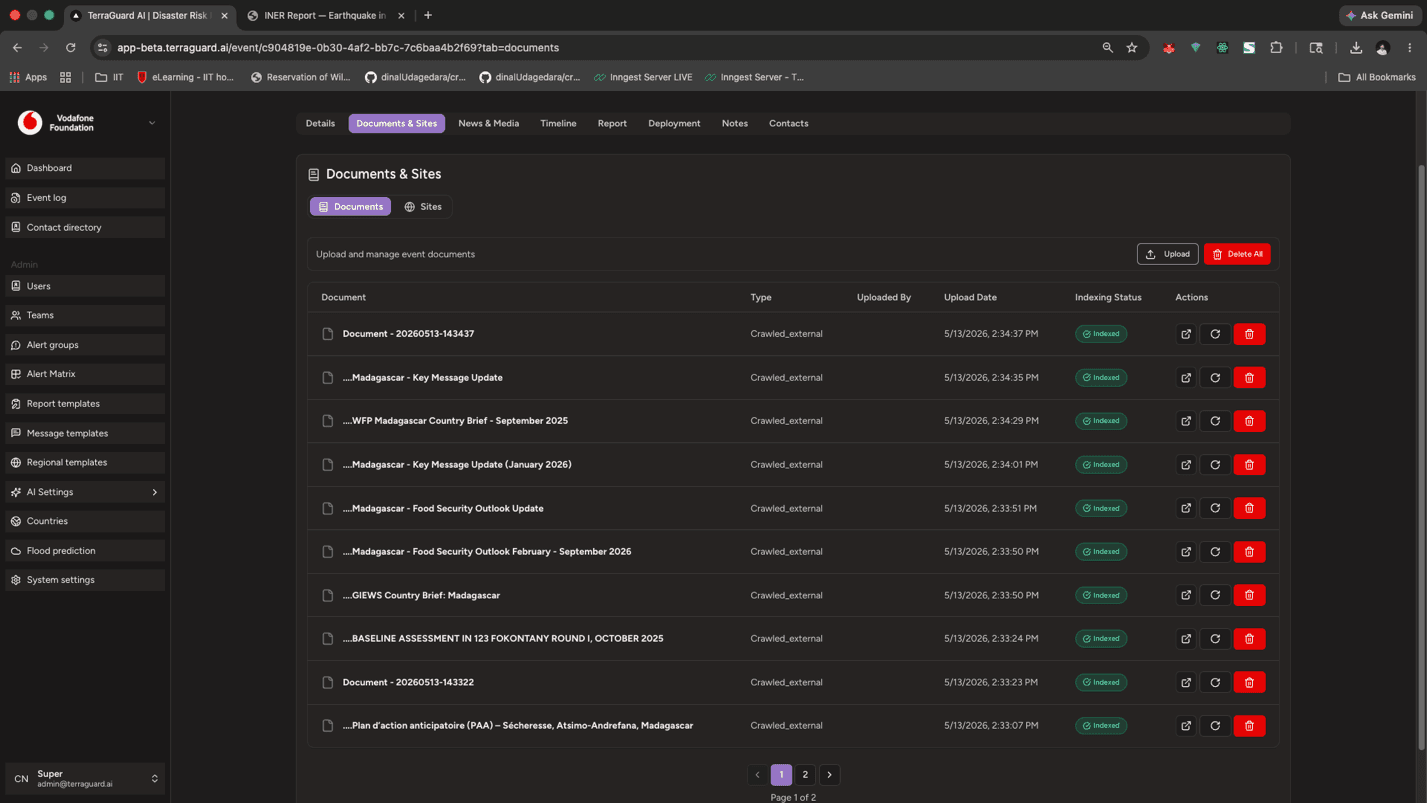
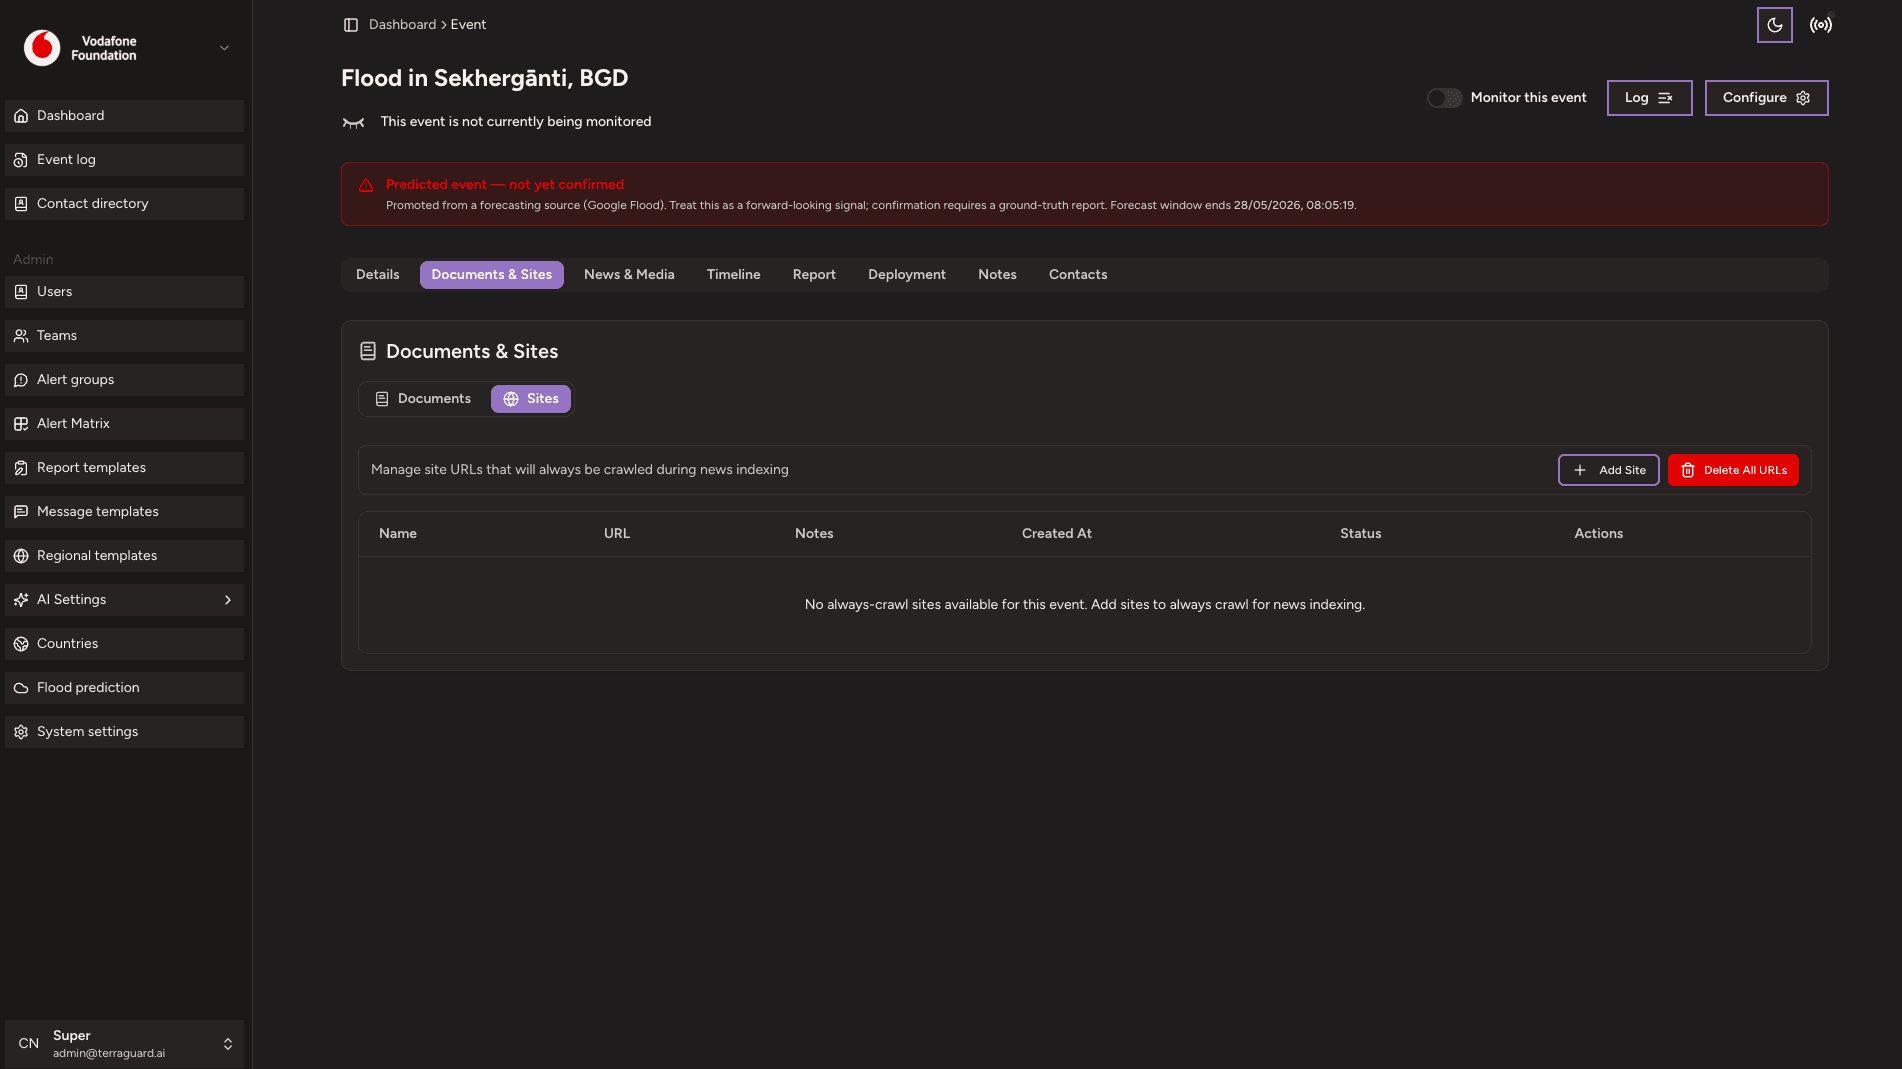
This tab is divided into two sub-tabs: Documents and Sites.
The Documents sub-tab stores files manually attached to the event — PDFs, situation reports, maps, or any other supporting material. Users with the Admin, or higher role can click Upload Document to attach a file, or drag and drop a file anywhere onto the card. The table lists each document with its name, type, and upload date. The Delete All button removes every document at once; individual rows have their own delete action. Members can view but not upload or delete.
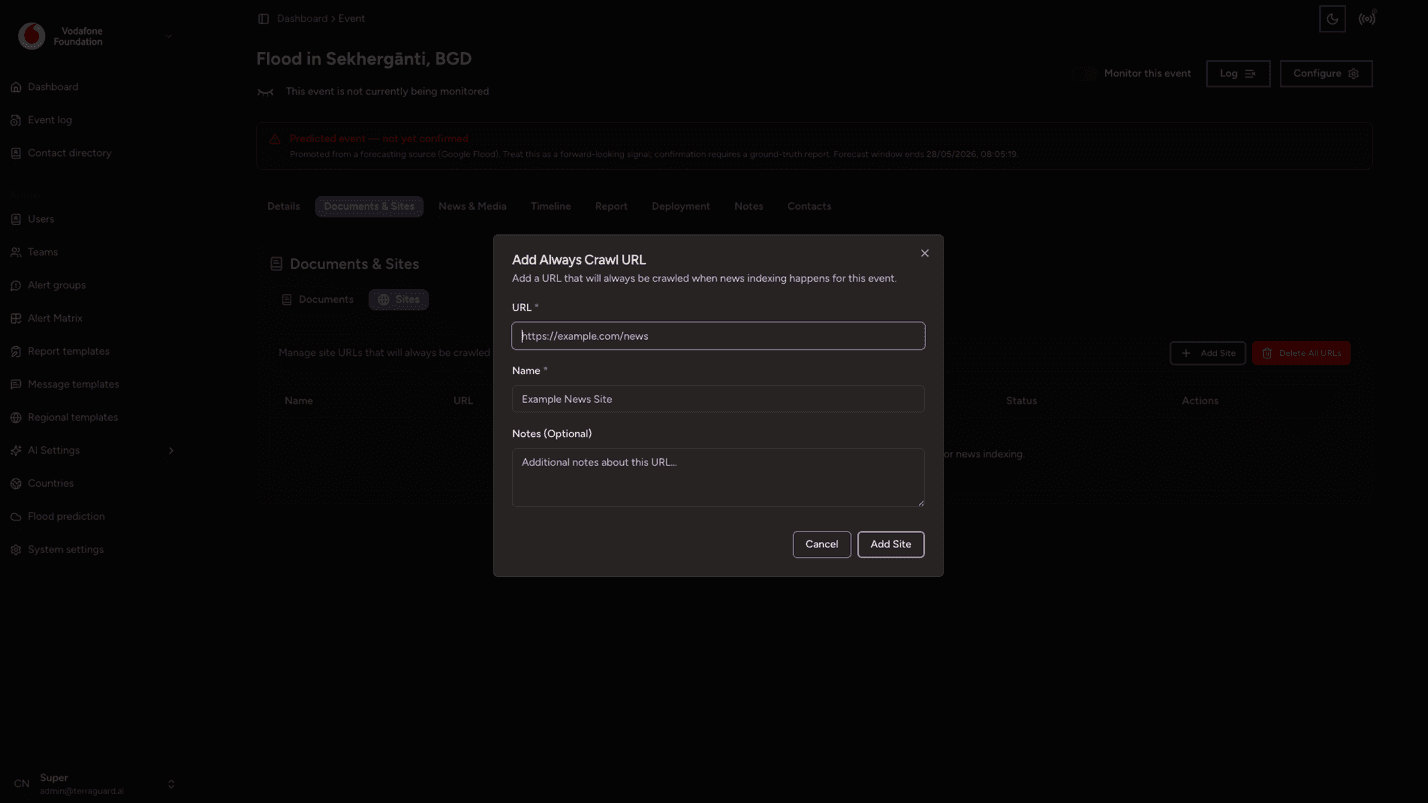
The Sites sub-tab manages 'Always Crawl' URLs — specific web pages that will be included in every automated news-crawl run for this event, regardless of whether the search engine returns them. This is useful for official situation-report pages, government advisories, or trusted humanitarian sources. Click Add URL, paste the address, and confirm. The URL will be fetched and indexed on the next crawl. The table shows each URL and when it was added. Admins and Managers can add and delete entries; Members have read-only access.
News & Media Tab
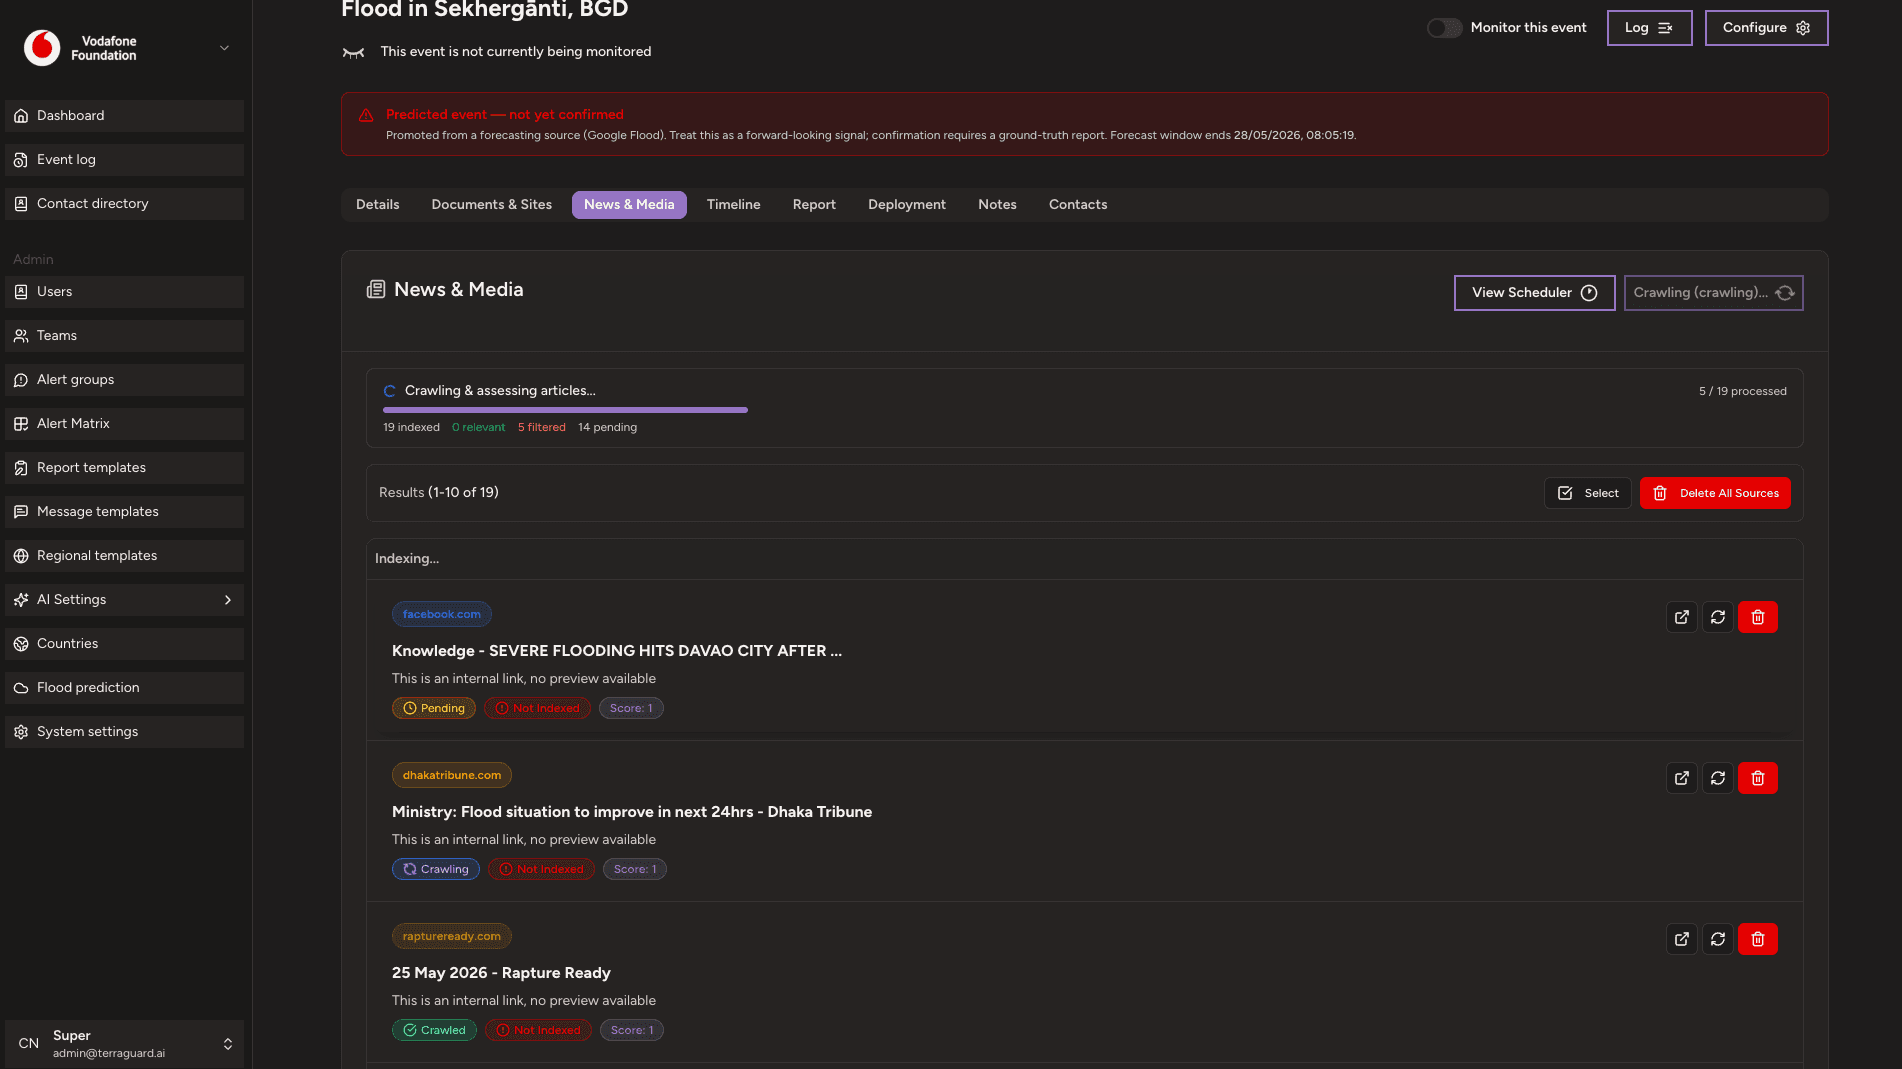
The News & Media tab shows every news article and media item that has been crawled and indexed for this event. The header row shows the last crawl date and provides two controls for non-Member roles: the News Crawler Scheduler (to configure automatic recurring crawls) and the Crawl News Articles button to trigger an immediate sync.
When a crawl is running, a live pipeline progress bar appears below the header. It shows the current phase (Starting, Searching for articles, Crawling & assessing articles, or Complete) alongside a progress counter showing how many articles have been processed out of the total found. Counters for relevant articles kept, irrelevant ones filtered out, pending items, and any errors are shown in a compact stats row below the bar.
The table lists each article with its title (linked to the source), content preview, URL, timestamp, crawling status, indexing status, relevance score, and the search engine that surfaced it. Pagination shows ten articles per page with numbered page buttons. Non-Members can enter Select mode to bulk-delete articles using checkboxes; a 'Select all N' option spans all pages.
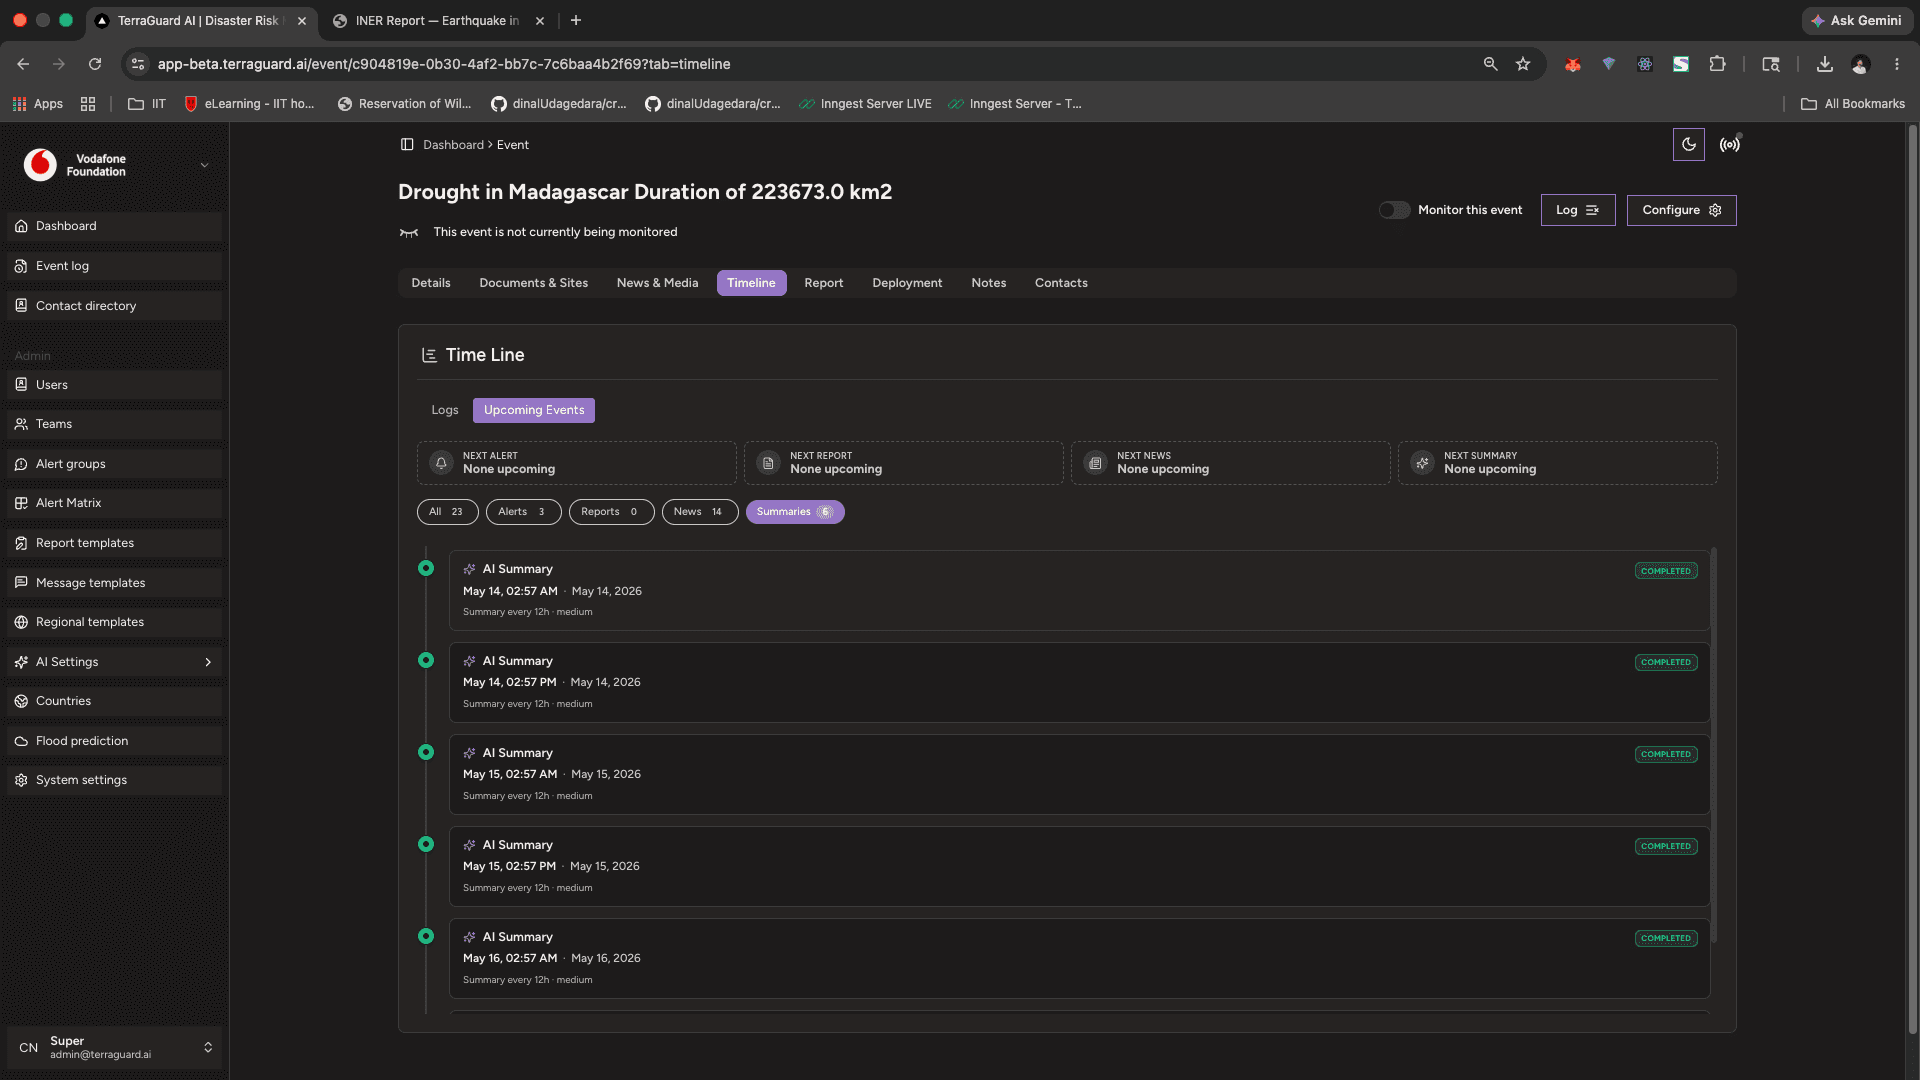
Timeline Tab (Super Admin only)
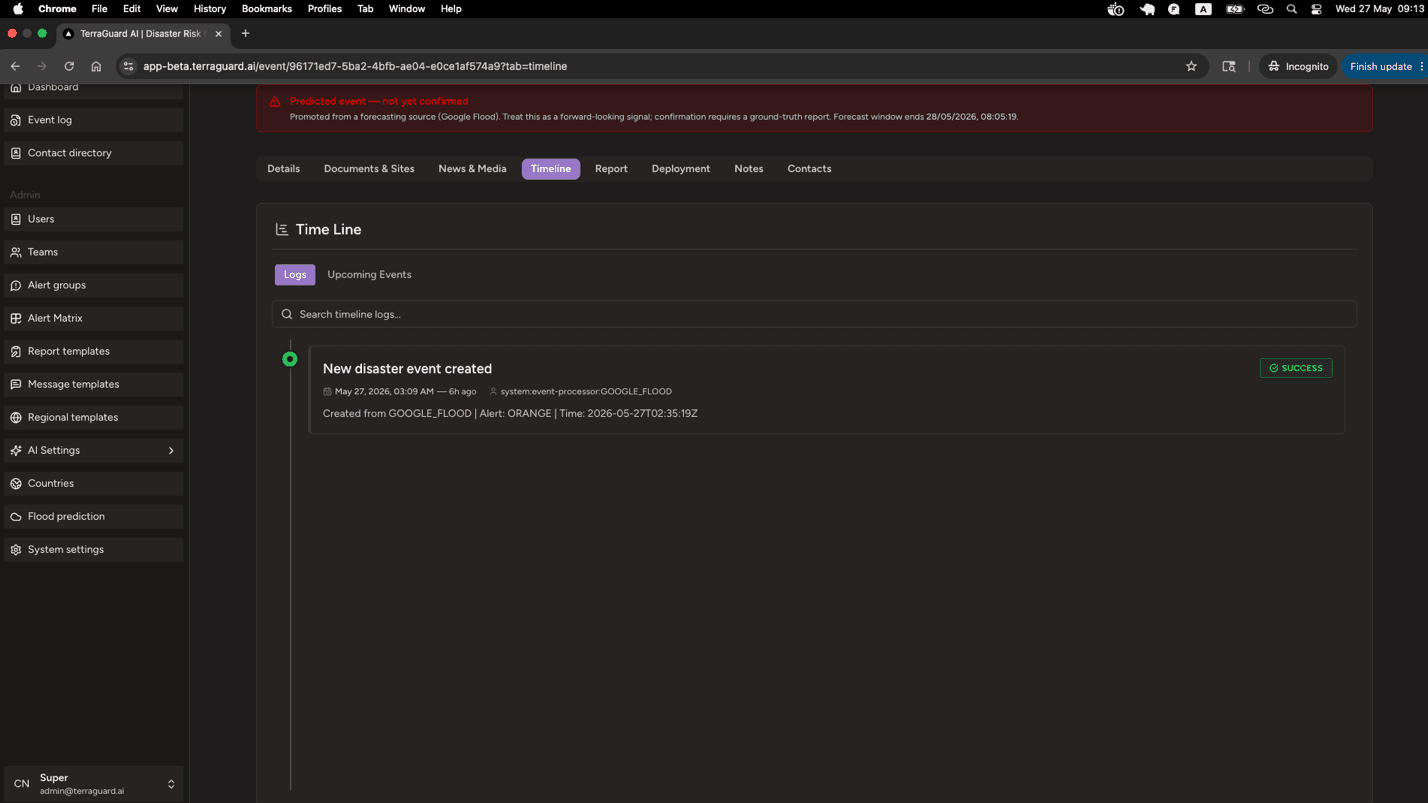
The Timeline tab is visible only to Super Admins. It has two sub-tabs: Logs and Upcoming Events.
The Logs sub-tab shows a chronological audit trail of every system action taken on this event. Each log entry is displayed as a card on a vertical timeline with a colour-coded dot matching its status. The entry shows a title, status badge (SUCCESS, WARNING, ERROR, PENDING, SKIPPED, or INFO), the exact timestamp and relative time, and the system actor or user who performed the action. Long descriptions are truncated with a 'Show more details' toggle. A search box at the top filters entries by keyword in real time. Pagination shows ten entries per page.
The Upcoming Events sub-tab lists all scheduled jobs queued for this event, such as news crawls and report-generation tasks. This mirrors the global Scheduled Jobs page but is filtered to the current event.
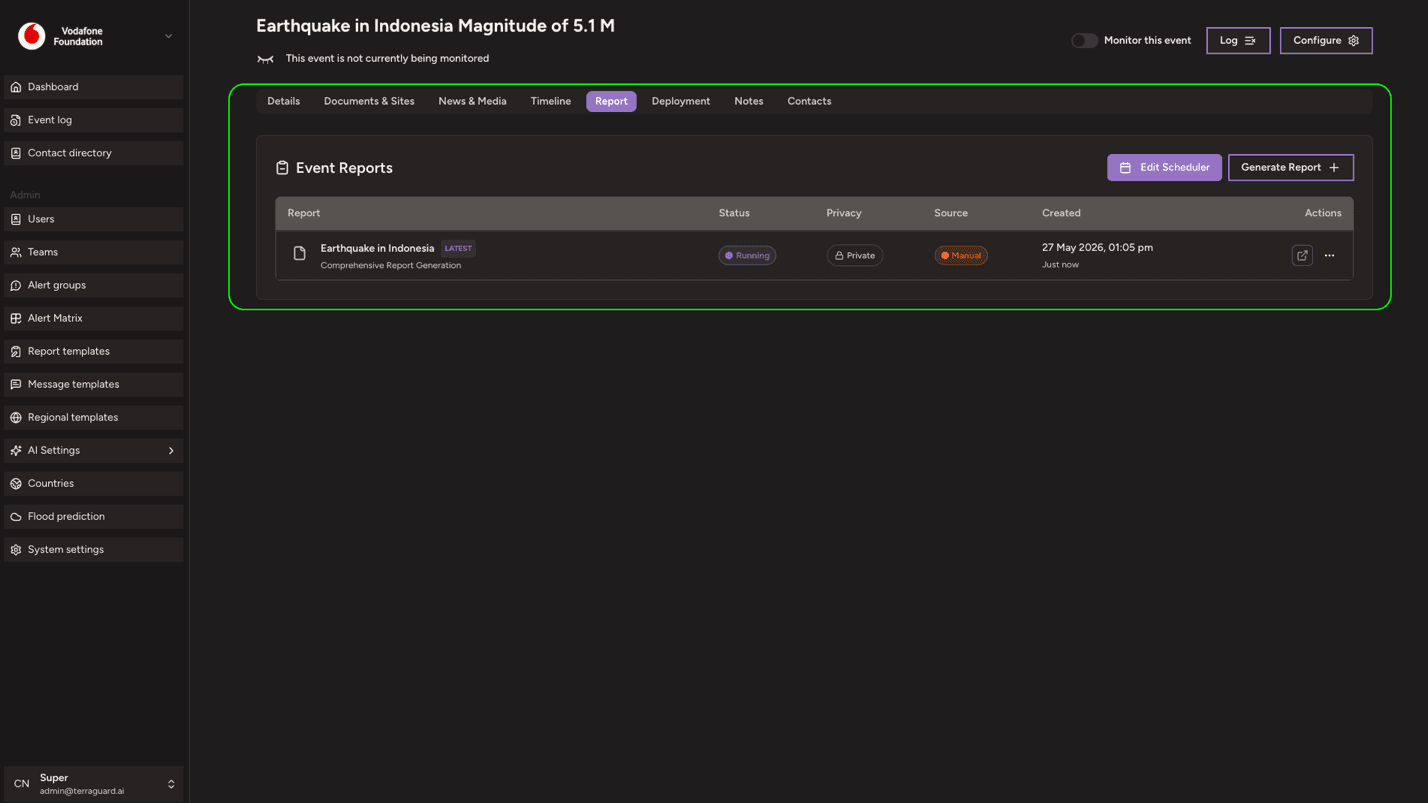
Report Tab
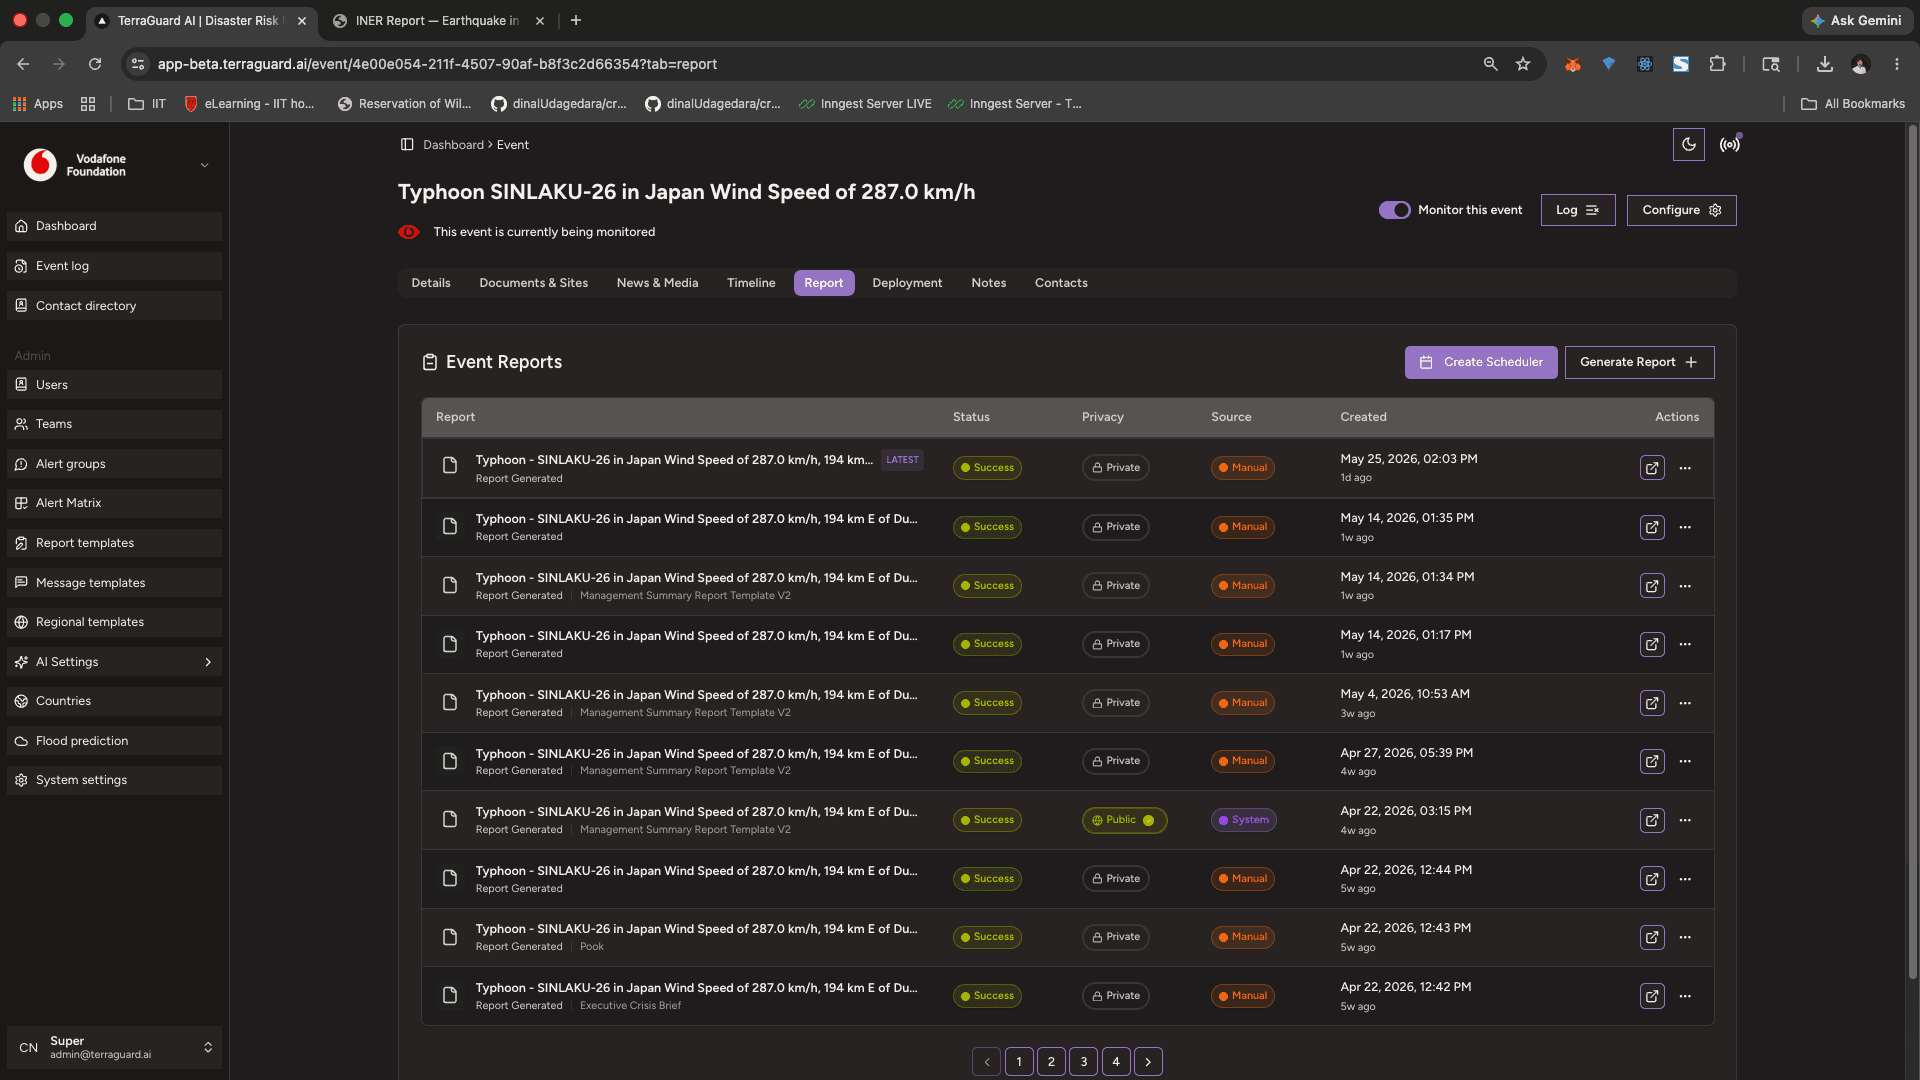
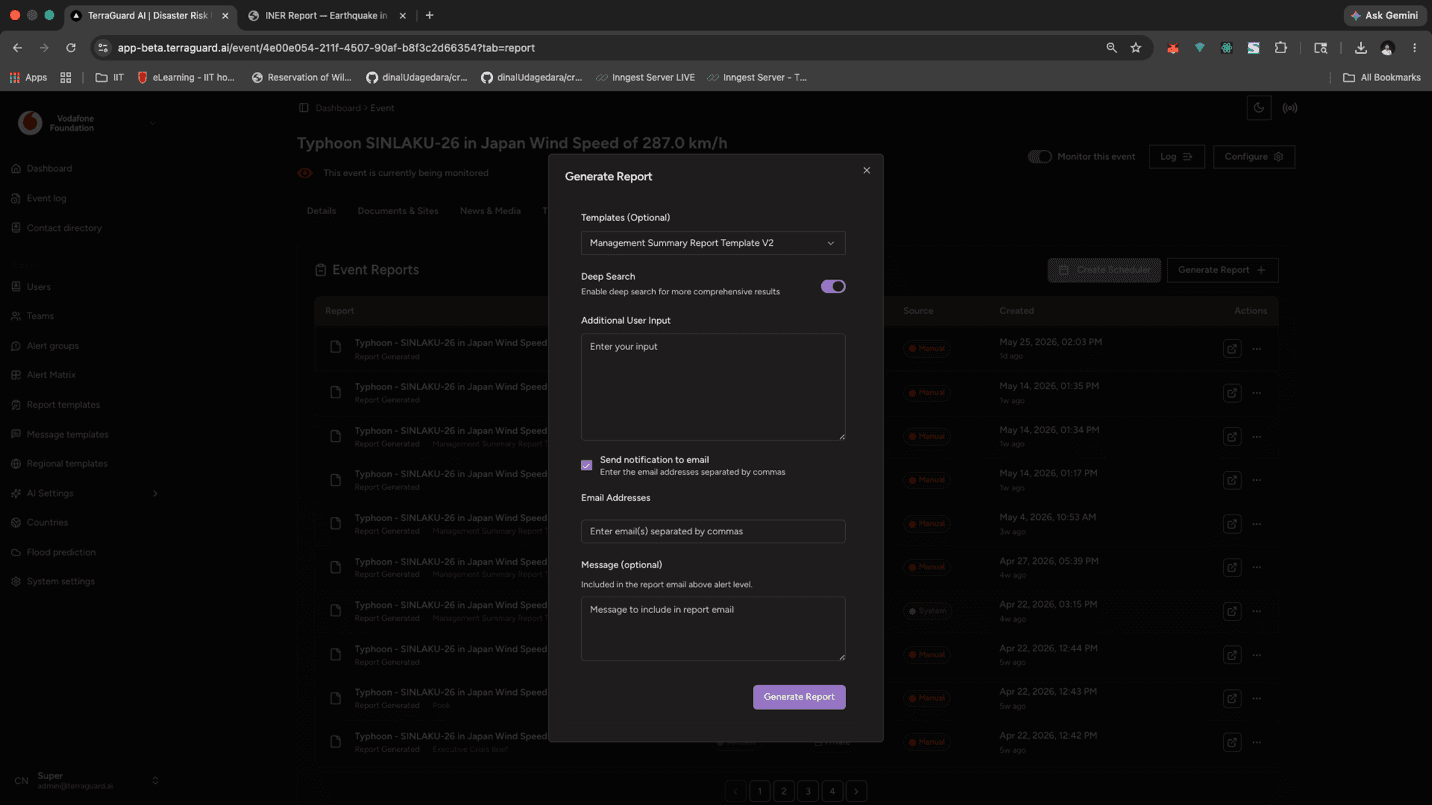
The Report tab is where formal event reports are generated and managed. Non-Member roles see two buttons in the header: Schedule Report (to set up automatic recurring report generation) and Generate Report (to produce a report immediately).
Clicking Generate Report opens a dialog where you configure the report parameters, then the AI ReAct agent runs and writes the report. Once complete, the report appears as a row in the reports table below. The table lists all previously generated reports with their generation date, template used, and status. Clicking a row opens the full report for reading or export.
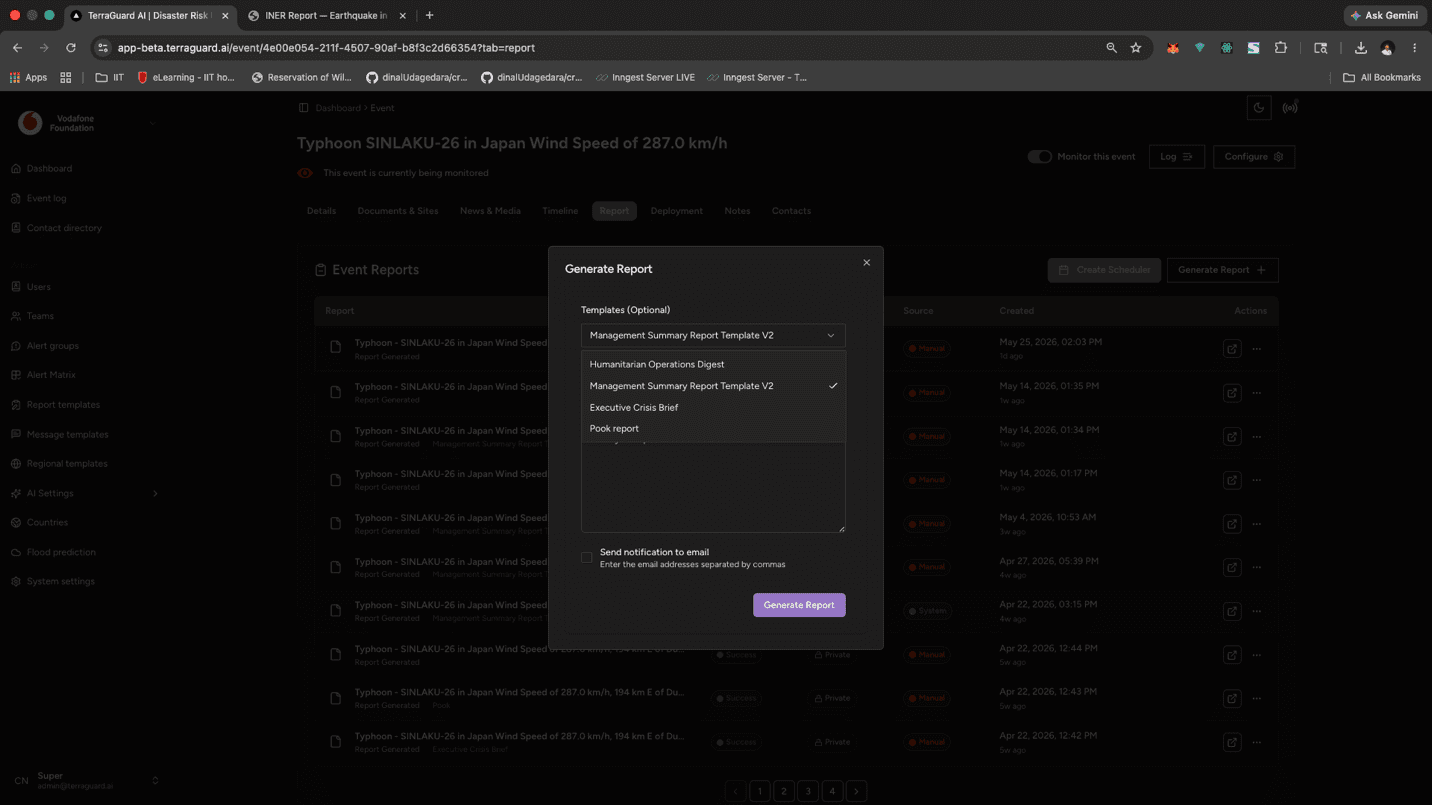
Report Generation options
Select the template that the report should use. You can also send the generated report to additional recipients immediately after generation by adding their email addresses.
Deployment Tab
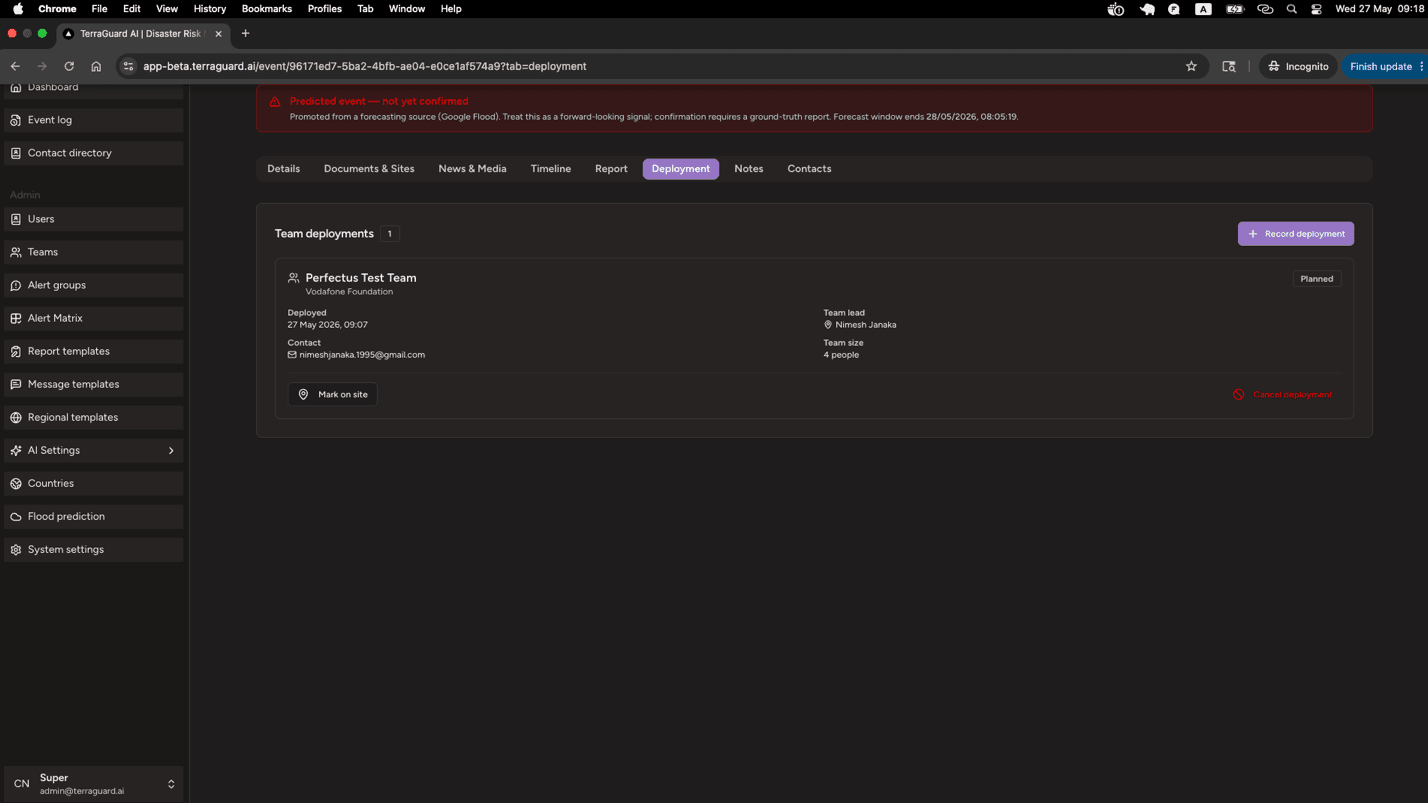
The Deployment tab records all Vodafone Foundation team deployments associated with this event. Admins and Super Admins can click Record deployment to log a new dispatch.
Each deployment appears as a card showing: team name and organisation, a status badge (Planned, Deployed, On site, Returned, or Cancelled), the deployment date, on-site arrival date, return date, deployment purpose, team lead name and contact details, team size, and free-text notes. The status progresses through its lifecycle using the action buttons at the bottom of each card: Mark on site, Mark returned, and Cancel deployment. Terminal statuses (Returned, Cancelled) show no further actions.
Notes Tab
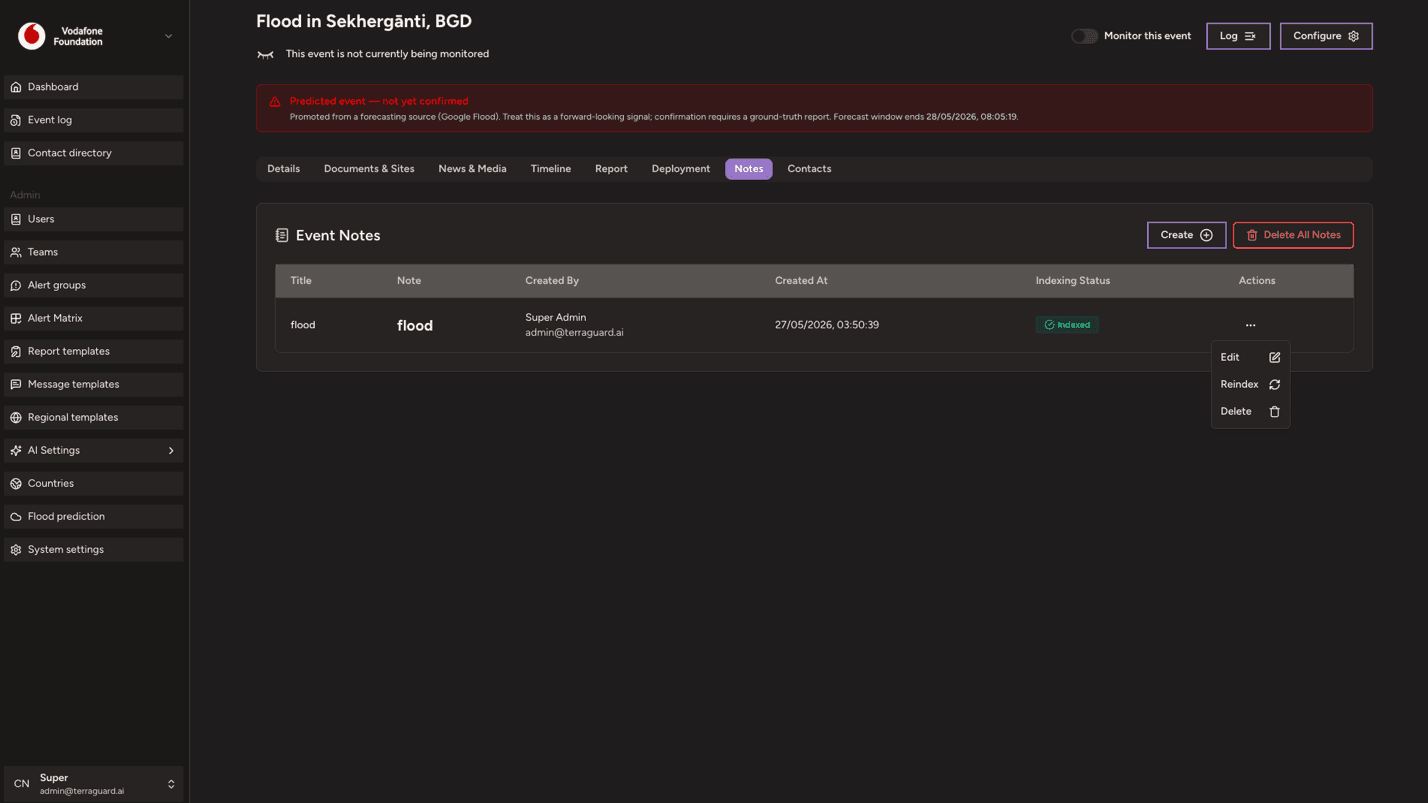
The Notes tab stores internal notes about an event — observations, decisions, action items, or anything your team needs to record that is not part of the formal report. The tab is hidden from Members; Viewers and above can read notes, while Managers and Admins can create and delete them.
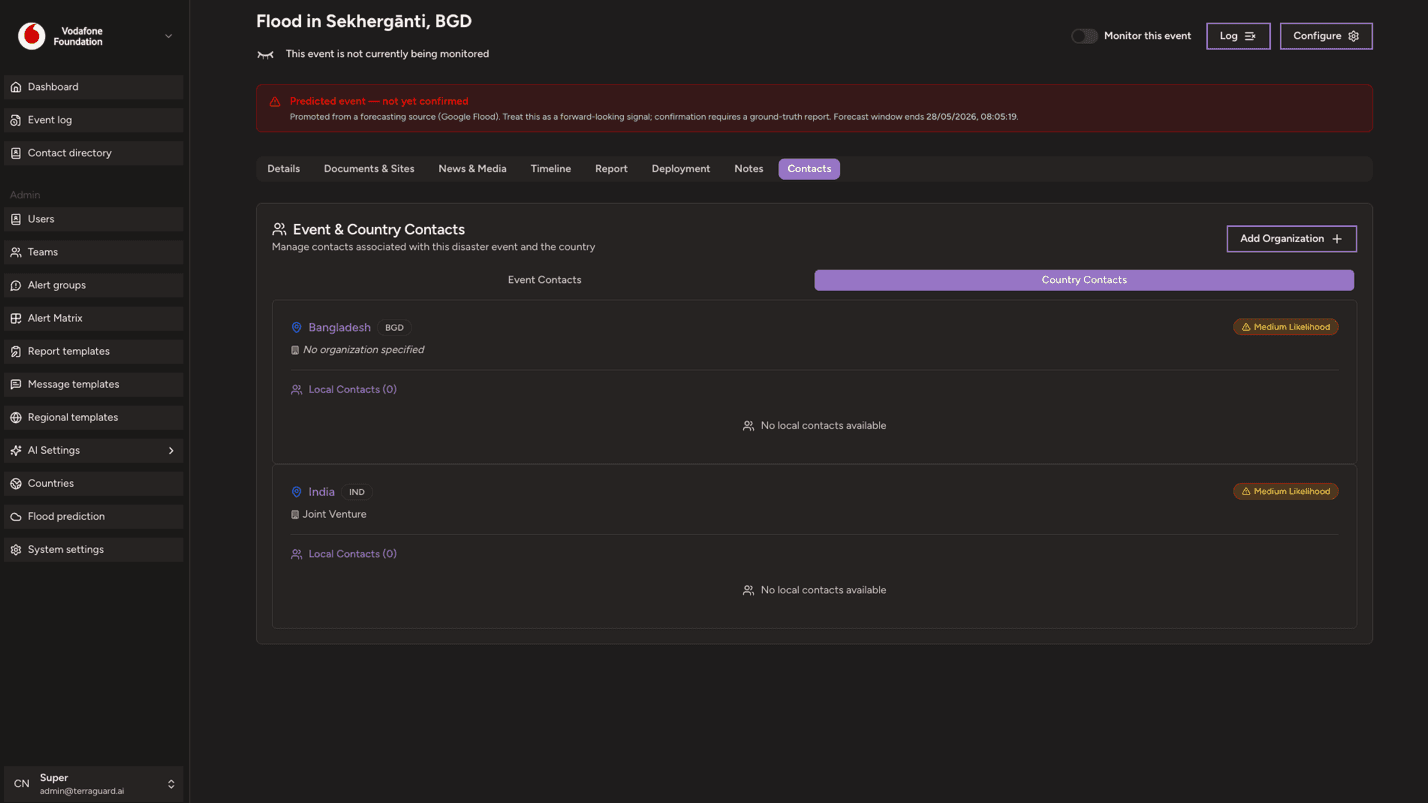
Contacts Tab
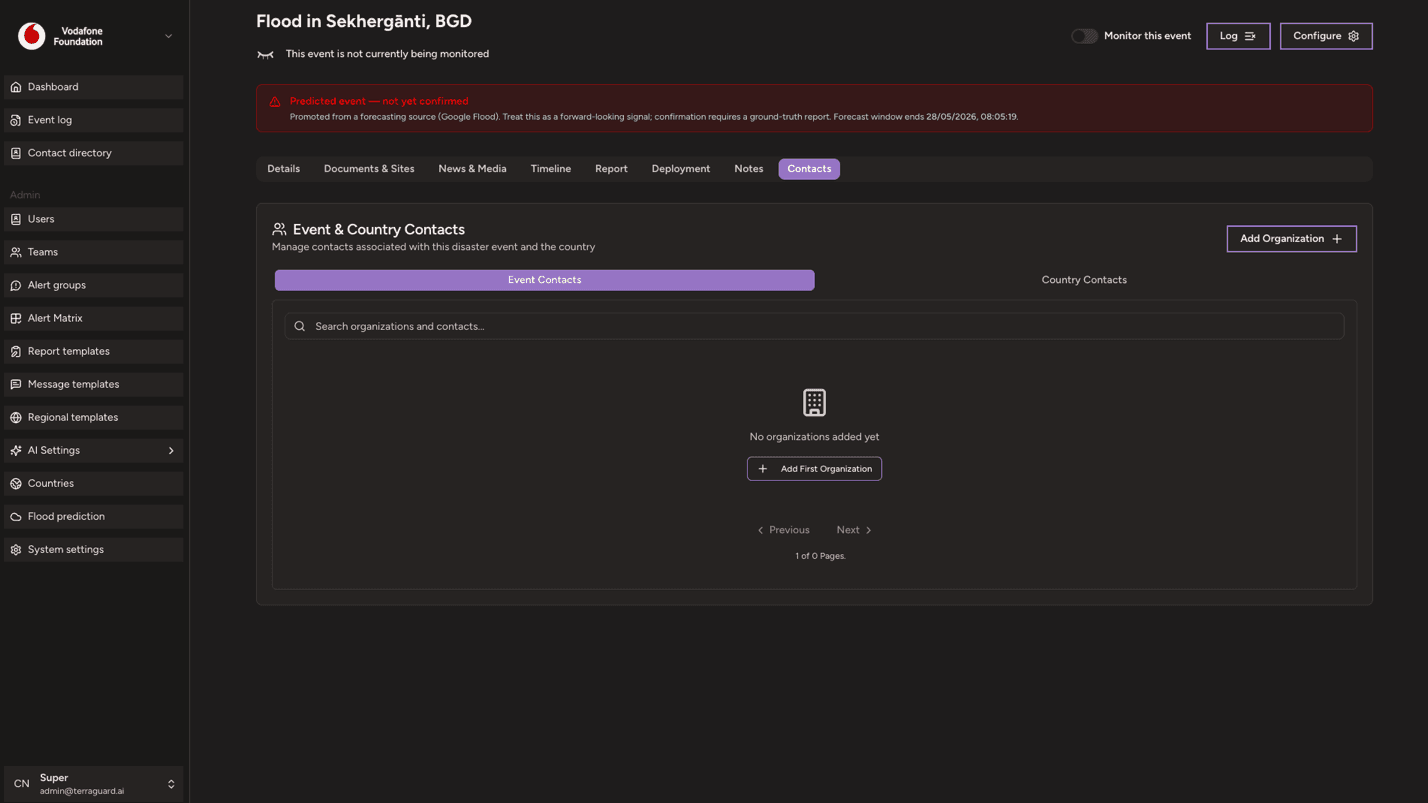
The Contacts tab consolidates all contact information relevant to this event into two sub-tabs: Event Contacts and Country Contacts.
Event Contacts lists organisations manually associated with this specific event. Each organisation card shows its name, type, country, and all contact methods (email, phone, WhatsApp, website). Org Managers and Super Admins see an Add Organization button in the header to manually add a new organisation entry, and each card has Edit and Delete actions. Within an organisation, contacts can be added, edited, and removed individually. A filter sidebar lets you narrow the list by contact type, organisation type, country, whether they are primary contacts, whether they were AI-extracted, and whether they have contact methods recorded. A search bar filters by name in real time. The list is paginated at 20 organisations per page.
Country Contacts pulls in the contact records stored in the Countries configuration for each country affected by this event. Each country card shows the country name, the associated entity name, a deployment likelihood badge (High / Medium / Low), and the list of local contacts with their name, role, organisation, and contact details (email, phone, or website). These contacts are read-only here — they are managed from the Countries page in the Admin settings.
Filtering and Searching Events in Event log
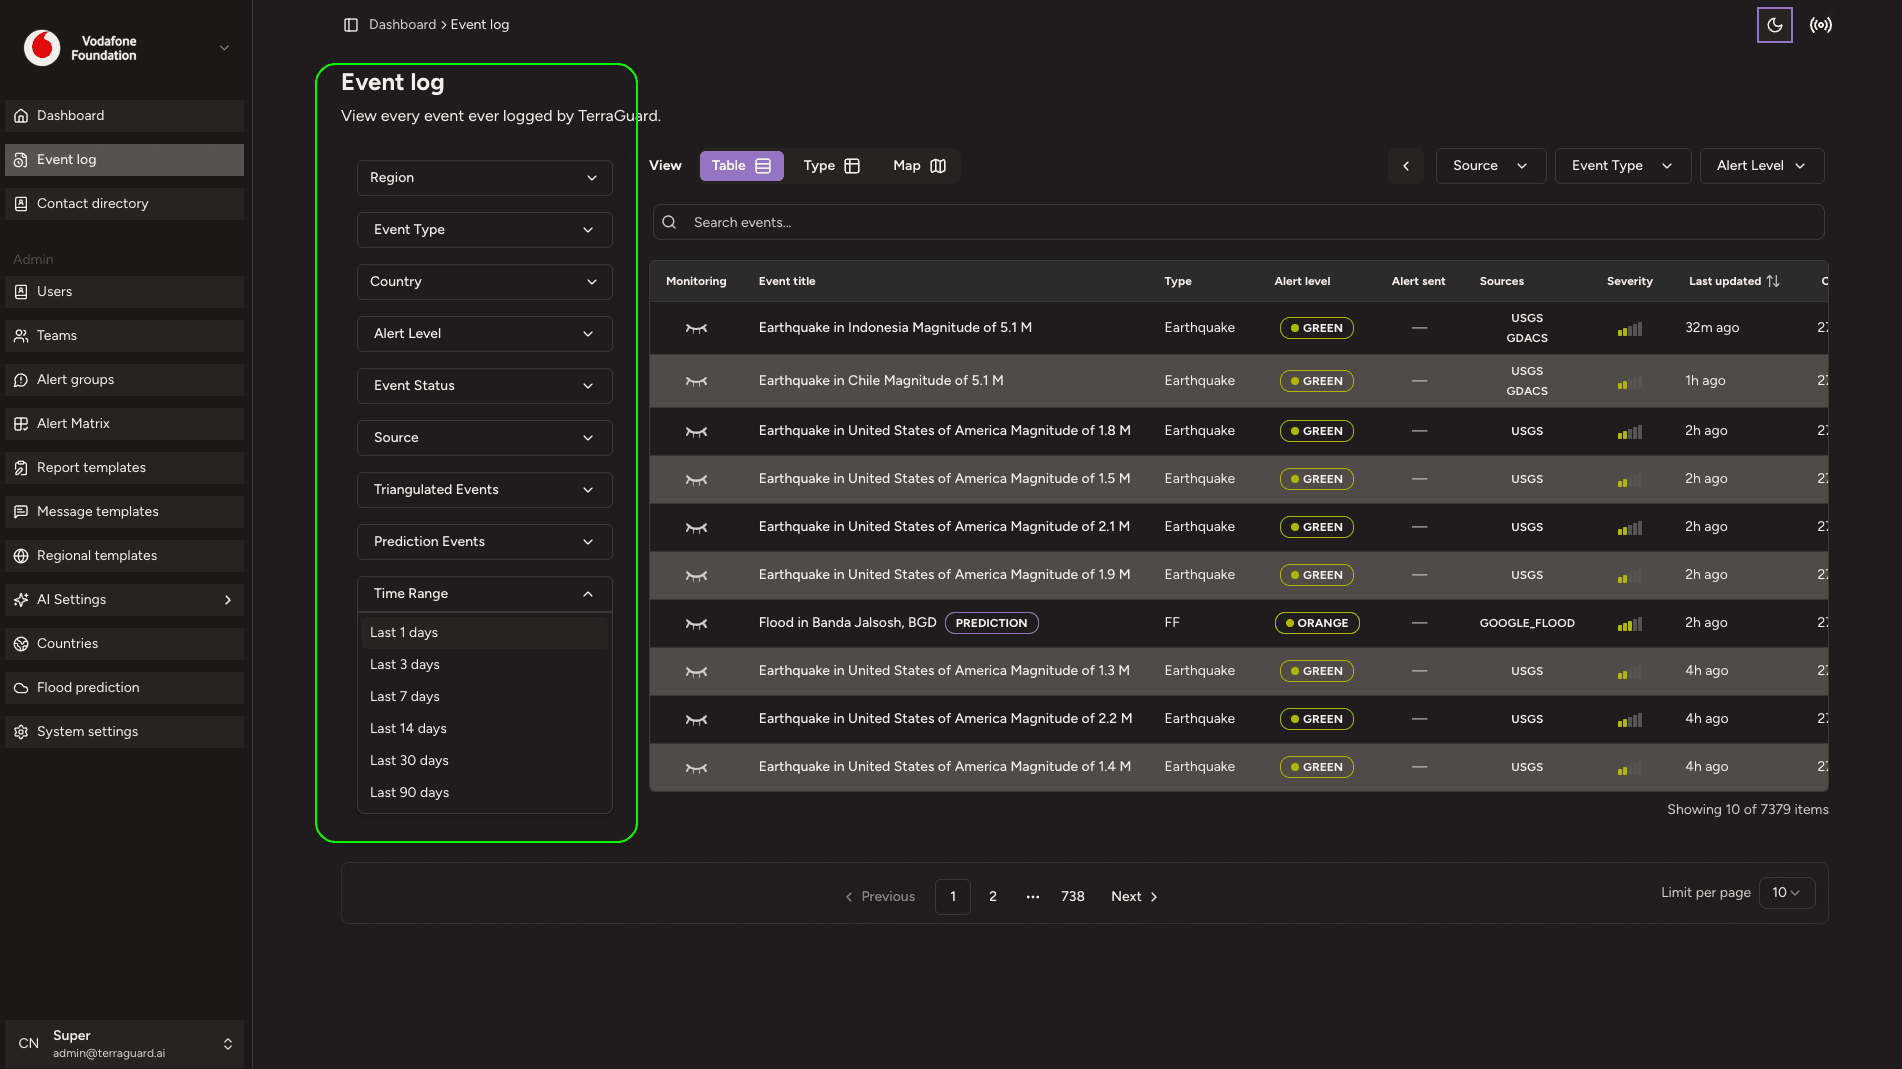
Use the Filters panel to narrow down events by event type, alert level, date range, country or region, and data source. Use the search bar to search by keyword or location name.
Monitoring an Event
To mark an event for active monitoring, click the eye icon in the Monitoring column. Monitored events appear on your dashboard Significant Events table.
Dashboard
The Dashboard is the primary interface for monitoring disaster events. It combines an interactive map with a filterable event list, giving response teams…
Contact Directory
The Contact Directory stores the details of individuals and organizations who can be contacted in relation to an event. Contacts are added in two ways:…